Rich Lederer • Baseball Beat
Patrick Sullivan • Change-Up
Jeremy Greenhouse • Touching Bases
Dave Allen • F/X Visualizations
Sky Andrecheck • Behind the Scoreboard
Marc Hulet • Around the Minors
Al Doyle • Past Times
Retired Uniforms:
Bryan Smith • WTNY
Joe Sheehan • Command Post
Jeff Albert • The Batter's Eye
RSS Feed
Home
*Examining the Past, Present, and Future*
Lineup Card
Recent Entries
» Putting Together a Reality Team
» Historical Hall of Fame Vote Comparisons: 2012
» An All-Christmas Team
» The New-Look Angels
» John Denny: The Forgotten Cy Young Award Winner
» Money Isn't Everything
» What Would It Take to Hit .400 in the 21st Century?
» Halos Heaven
» Brandon McCarthy's Breakout Season
» Link-o-Rama
» Historical Hall of Fame Vote Comparisons: 2012
» An All-Christmas Team
» The New-Look Angels
» John Denny: The Forgotten Cy Young Award Winner
» Money Isn't Everything
» What Would It Take to Hit .400 in the 21st Century?
» Halos Heaven
» Brandon McCarthy's Breakout Season
» Link-o-Rama
Best of Baseball Beat
Abstracts From the Abstracts
1977 Baseball Abstract
1978 Baseball Abstract
1979 Baseball Abstract
1980 Baseball Abstract
1981 Baseball Abstract
1982 Baseball Abstract
1983 Baseball Abstract
1984 Baseball Abstract
1985 Baseball Abstract
1986 Baseball Abstract
1987 Baseball Abstract
1988 Baseball Abstract
1978 Baseball Abstract
1979 Baseball Abstract
1980 Baseball Abstract
1981 Baseball Abstract
1982 Baseball Abstract
1983 Baseball Abstract
1984 Baseball Abstract
1985 Baseball Abstract
1986 Baseball Abstract
1987 Baseball Abstract
1988 Baseball Abstract
Bert Blyleven Series
Meeting Up and Hanging Out with Bert
The Results Are In And...
Aficionado Heavily Invested in Blyleven
Latest on Blyleven's Chances for the HOF
The Internet Zealot Responds
400 Down and 5 to Go...
Bert Be Home By Eleven?
Blyleven's Forgotten Season (1973)
HeyMan, Your Comments Don't Hold Water
The Waiting is the Hardest Part
Another Addition to the Blyleven Series
Search for the Truth
As Dominant as His HOF Contemporaries
Listen, Buster
A Larger Step for Blyleven
Answering the Naysayers (Part Two)
Another Small Step for Blyleven
Q&A: Blyleven on the Twins
The Majority Rules, Right?
It's All Dutch to Some
The Hall of Fame Case for Bert Blyleven
Q&A: Blyleven on Felix Hernandez
Clemens Rocketing Up Charts
Poz: An Interview With a KC Star
A HOF Chat with Tracy Ringolsby
Up Close and Personal
A Peek Into the Mind of a HOF Voter
Answering the Naysayers
It's That Time of the Year (Again)
"If Cooperstown is Calling..."
The Bert Alert
One Small Step for Blyleven...
Only the Lonely
Exclusive Interviews
Lee Sinins
Alex Belth
David Pinto
Will Carroll
Mike Carminati
Aaron Gleeman
Joe Sheehan
Jay Jaffe
Jeff Peek
Tracy Ringolsby
Joe Posnanski
Bill James Part I, II, III
Jon Lalonde
Chuck Tiffany
Dayn Perry
Fay Vincent
Nate Silver
Alex Belth
David Pinto
Will Carroll
Mike Carminati
Aaron Gleeman
Joe Sheehan
Jay Jaffe
Jeff Peek
Tracy Ringolsby
Joe Posnanski
Bill James Part I, II, III
Jon Lalonde
Chuck Tiffany
Dayn Perry
Fay Vincent
Nate Silver
Bullpen
Rich Lederer
The Odd Couple (with Alex Belth)
The MostUnder Over Underrated Player in Baseball (with Brian Gunn)
Three Wise Men (roundtable by Alex Belth)
Infrequently Asked Questions (interview with Matt Welch)
Interview (Orioles Think Tank)
Bernie and the Yanks (Bronx Banter)
Hope and Faith: How the LAA Win the World Series (Baseball Prospectus)
NL West (The Soul of Baseball)
Greatest Living Hitter? (Sports Illustrated)
Roundtable: 2008 HOF Ballot (Armchair GM)
The Most
Three Wise Men (roundtable by Alex Belth)
Infrequently Asked Questions (interview with Matt Welch)
Interview (Orioles Think Tank)
Bernie and the Yanks (Bronx Banter)
Hope and Faith: How the LAA Win the World Series (Baseball Prospectus)
NL West (The Soul of Baseball)
Greatest Living Hitter? (Sports Illustrated)
Roundtable: 2008 HOF Ballot (Armchair GM)
Patrick Sullivan
Designated Hitters
David Bromberg (Q&A: John Denny)
Mark Armour (H. Killebrew and Versatility)
Joe Lederer (Soundtrack of a Prospect)
David Bromberg (Clemente's Autograph)
David Bromberg (Woody Fryman)
D. Baumstein (WAR Against Age: Pitchers)
Doug Baumstein (The WAR Against Age)
Doug Baumstein (A Lifetime on the Road)
John Fraser (Pick Six)
Mark Armour (How to Score More Runs?)
Bill Parker (What Opening Day Tells Us)
Stan Opdyke (Pat Rispole)
Chris Jaffe (Evaluating Baseball's Mgrs)
Stan Opdyke (Baseball Radio in NYC, 1953)
A. Nathan (Performance of Baseball Bats)
Michael Weddell (Edgar Martinez/HOF)
Jon Weisman (100 Things Dodgers Fans...)
Stan Opdyke (Connie Mack and Vin Scully)
Eric Walker (Evaluating Run Production)
Brent Mayne (The Intangibles of Catching)
Chris Moore (Best Fastballs in Baseball)
Dave Baldwin (The Batter’s Brain)
Shawn Haviland (Ivy League to MLB)
Larry Granillo (Walking Off)
Rob Iracane (Solo HR Won't Break You)
Tommy Bennett (Charm of AM Radio)
Harry Pavlidis (Johan Santana's Fast Start)
John Walsh (WAR and Remembrance)
Eric Walker (Precisely Inaccurate)
Bob Timmermann (As They See 'Em)
Geoff Young (Unicycles and Delusions)
Baseball Analysis at Tufts (Groundballers)
Baseball Analysis at Tufts (GB Out Rates)
G. Rybarczyk ('09 Hit Tracker Projections)
Joe Lederer (Curt Schilling/HoF)
Conor Gallagher (Hall of Fallacies)
Chris Green (Jim Rice, HoF, the Numbers)
Shawn Hoffman (Baseball's Bear Mkt?)
Paul Anthony (Manny Syndrome)
Ross Roley (World Series Odds)
B. Timmermann (Catcher's Interference)
R.J. Anderson (Waiting the Hardest Part)
Maury Brown (Cubs, MLB, and Cuban...)
Myron Logan (Dee-Fense, Dee-Fense)
Craig Calcaterra (Frivolity, Part I, Part II)
Chad Finn (Ode to Baseball Cards)
David Cameron (Mariners Foibles)
Chris Dial (Chipper Jones)
Pat Lederer (Memory Lane)
David Appelman (Clutch Pitching)
Bob Rittner (DH)
Jonathan Mayo (Roger Clemens)
Lisa Winston (My Son-in-Law...)
Russ McQueen (The Yellow Hammer)
Bob Rittner (I'm OK, You're OK)
Mark Armour (In Defense of the HOF)
Pat Jordan (Friends)
Dan Levitt (Analysis of Terry Ryan)
Doug Baumstein (Trading Econ 101)
Ross Roley (Runner's Reluctance II)
Ross Roley (Runner's Reluctance I)
Mark Armour (No-Longer Lovable Sox)
Bruce Regal (Stealthy and Wise)
Brian Gunn (Roid Monster)
Current/McEvoy (Value of the SB)
John Rickert (Sinister Thefts)
Nate Silver (Sabermetrics)
David Vincent (Home Run Production)
Joe P. Sheehan (Enhanced Gameday II)
Mark Armour (An Ode to Sport)
David Gassko (All-Time Worm Burners)
Joe P. Sheehan (Enhanced Gameday)
John Walsh (When Titans Clash)
Fox/Williams (Quantifying Coaches II)
Fox/Williams (Quantifying Coaches I)
Jacob Luft (Bull Durham Rant)
Chad Finn (Strat-O-Matic)
Lisa Winston (Rotisserie Baseball)
Dave Studeman (Baseball Stats)
Steve Treder (Roger Craig)
Marc Normandin (Jeff Bagwell)
D. Appelman (Expanding Strike Zone)
Jeff Sackmann (Worst MiL Defenders)
Jeff Sackmann (Best MiL Defenders)
Maxwell Kates (Van Lingle Mungo)
David Appelman (Pitch Location)
Kent Bonham (Danny Ray Herrera)
Glenn Stout (Two Baseball Poems)
Bruce Regal (The Challenge Round)
Mark Lamster (Barry & Ty)
Geoff Young (NL West)
Tom Lederer (The Ryan Express)
Brian Erts (Great Leap Forward)
David Pinto (Parity and the N.L.)
Jacob Luft (Fathers and Daughters)
Jamey Newberg (Pete's Sake)
Jeff Albert (A. Jones Swing Analysis)
Jeff Albert (A-Rod Swing Analysis)
Keith Law (Death, Taxes, and Waivers)
Peter Abraham (Tales of Torre Tales)
Larry Borowsky (Let 'er Rip II)
Dan Levitt (Empirical Analysis of Bunting)
Jonah Keri (If I Met Warren Cromartie...)
Bob Klapisch (War Stories)
Bob Timmermann (John F. Kennedy HS)
Kent Bonham (Aluminum Adjustments)
Al Doyle (More Than Superstars)
Ross Roley (Instant Replay)
David Vincent (Barry Bonds Homers)
Chad Finn (Our Favorite Obscurities)
Bill Deane (1979 NL MVP)
Mark Armour (Rise/Fall of Artificial Turf)
Jeff Angus (Wally Moon Camp)
David Berri (Money and Baseball)
Larry Borowsky (Baseball w/o the #s)
Derek Zumsteg (The Irrational Market)
David Regan (Free Agent Contracts)
Peter Schmuck (Steroids and the HOF)
David Appelman (Pitchers, Pitch by Pitch)
Dan Fox (Swinging, Taking, Fouling, Etc)
Patrick Sullivan (Study of NYY CF/BOS LF)
Will Leitch (Baseball Journalism)
Jeff Sullivan (Pitcher Release Points)
Steve Treder ('69-'70 Giants)
Maury Brown (Charlie Finley)
John Brattain (Bob Johnson)
Bob Klapisch (The Case for Bert Blyleven)
Jeff Peek (Pride and Prejudice)
Dayn Perry (Bert and Warren)
Rob Neyer (If Don Sutton Was Great...)
Lisa Winston (Minor League Memories)
Alex Belth (Otis Redding Was Right)
David Cameron (Long Live the King)
Jeff Angus (Baserunning Study)
Bert Blyleven (Baseball Playoffs)
Boyd Nation (Not a Prospect List)
James Click (Batters-Baserunners Study)
Jeff Shaw (Why I Love Baseball)
David Gassko (BIP/BFP Fielding Study)
Jay Jaffe (Milwaukee Sausage Race)
Jamey Newberg (Remember When)
Bob Klapisch (Press Box to the Mound)
Dan Levitt (Predictive Value of BB)
David Vincent (Official Scorer)
Jon Weisman (Rick Monday)
Larry Borowsky (Let 'er Rip)
Will Carroll (Fictional Short Story)
Bob Timmermann (Japanese Baseball)
Cyril Morong (Best Pitching Seasons)
Sean Forman (Monte Carlo Win-Loss)
Brian Gunn (My Little Blue Book)
Joe Lederer (My Dad and Baseball)
Bill Deane (Bob Gibson, 1968)
Mark Armour (1977 Yankees)
Darren Viola (Retrosheet)
David Pinto (RFK)
Dayn Perry (Brave Heart)
Matt Welch (Dave Hansen)
Kevin Kernan (Jack McKeon)
Tom Lederer (Dodgers Road Trip)
Steve Lombardi (Slider)
Studes (Picturing Baseball)
Mike Carminati (Luck of the Drawl)
Eric Neel (Vin Scully)
J.C. Bradbury (Leo Mazzone)
John Sickels (Bill James)
Search Baseball Analysts
Archives
By Category:
Around the Majors Content Only
Around the Minors Content Only
Baseball Beat Content Only
Baseball Beat/Change-Up Content Only
Baseball Beat/WTNY Content Only
Behind the Scoreboard Content Only
Change-Up Content Only
Change-Up/Around the Majors Content Only
Command Post Content Only
Crunching the Numbers Content Only
Designated Hitter Content Only
F/X Visualizations Content Only
Past Times Content Only
Saber Talk Content Only
The Batter's Eye Content Only
Touching Bases Content Only
Weekend Blog Content Only
WTNY Content Only
By Month:
February 2012
January 2012
December 2011
October 2011
September 2011
August 2011
July 2011
June 2011
May 2011
April 2011
March 2011
February 2011
January 2011
December 2010
November 2010
October 2010
September 2010
August 2010
July 2010
June 2010
May 2010
April 2010
March 2010
February 2010
January 2010
December 2009
November 2009
October 2009
September 2009
August 2009
July 2009
June 2009
May 2009
April 2009
March 2009
February 2009
January 2009
December 2008
November 2008
October 2008
September 2008
August 2008
July 2008
June 2008
May 2008
April 2008
March 2008
February 2008
January 2008
December 2007
November 2007
October 2007
September 2007
August 2007
July 2007
June 2007
May 2007
April 2007
March 2007
February 2007
January 2007
December 2006
November 2006
October 2006
September 2006
August 2006
July 2006
June 2006
May 2006
April 2006
March 2006
February 2006
January 2006
December 2005
November 2005
October 2005
September 2005
August 2005
July 2005
June 2005
May 2005
April 2005
March 2005
February 2005
January 2005
December 2004
November 2004
October 2004
September 2004
August 2004
July 2004
June 2004
May 2004
April 2004
March 2004
February 2004
January 2004
December 2003
November 2003
October 2003
September 2003
August 2003
July 2003
June 2003
Reference
Organizational Stats
Arizona Diamondbacks Bat / Pitch
Atlanta Braves Bat / Pitch
Baltimore Orioles Bat / Pitch
Boston Red Sox Bat / Pitch
Chicago Cubs Bat / Pitch
Chicago White Sox Bat / Pitch
Cincinnati Reds Bat / Pitch
Cleveland Indians Bat / Pitch
Colorado Rockies Bat / Pitch
Detroit Tigers Bat / Pitch
Florida Marlins Bat / Pitch
Houston Astros Bat / Pitch
Kansas City Royals Bat / Pitch
Los Angeles Angels Bat / Pitch
Los Angeles Dodgers Bat / Pitch
Milwaukee Brewers Bat / Pitch
Minnesota Twins Bat / Pitch
New York Mets Bat / Pitch
New York Yankees Bat / Pitch
Oakland Athletics Bat / Pitch
Philadelphia Phillies Bat / Pitch
Pittsburgh Pirates Bat / Pitch
St. Louis Cardinals Bat / Pitch
San Diego Padres Bat / Pitch
San Francisco Giants Bat / Pitch
Seattle Mariners Bat / Pitch
Tampa Bay Devil Rays Bat / Pitch
Texas Rangers Bat / Pitch
Toronto Blue Jays Bat / Pitch
Washington Nationals Bat / Pitch
All-Star Links
Official Websites
News and Notes
Baseball News Blog
Baseball Newstand
ESPN Baseball
Fox Sports Baseball
Pro Sports Daily
Roto World
The Roto Times
USA Today Baseball
Baseball Newstand
ESPN Baseball
Fox Sports Baseball
Pro Sports Daily
Roto World
The Roto Times
USA Today Baseball
Reference and Analysis
Baseball Almanac
Baseball America
Baseball Archive
Baseball Contracts
Baseball Cube
Baseball Graphs
Baseball Library
Baseball Musings Player Database
Baseball Page
Baseball Primer
Baseball Prospectus
Baseball Reference
Baseball Statistics
Baseball Truth
Boxscore Central
Diamond Mind Baseball
Doug's Stats
FanGraphs
Fast Balls (pitchfx catalog)
Hardball Dollars
Hardball Times
Hit Tracker
Retrosheet
Rotobase/Rotoblog
Stat Corner
STATS
Tango on Baseball
Yahoo Sports MLB
Web Gems
Bill James Primer
Sabermetric Manifesto (Grabiner)
Pitching and Defense (McCracken)
Pitching and Defense (Tippett)
Transactions Primer (Neyer)
Baseball Stats (Batter's Box)
Prospect Report (Cameron)
Pitcher Workloads (Sheehan)
Goodbye to Old Baseball Ideas (Rickey)
Sabermetric Manifesto (Grabiner)
Pitching and Defense (McCracken)
Pitching and Defense (Tippett)
Transactions Primer (Neyer)
Baseball Stats (Batter's Box)
Prospect Report (Cameron)
Pitcher Workloads (Sheehan)
Goodbye to Old Baseball Ideas (Rickey)
Columnists
Baseball Blogs
Around the Majors
Athletics Nation
Baseball Crank
Baseball Musings
Baseball-Reference Blog
Batter's Box
Big League Stew
Bronx Banter
Catfish Stew
Cub Town
Dan Agonistes
Dodger Thoughts
DRays Bay
Ducksnorts
Futility Infielder
Halos Heaven
Inside the Rockies
It Might Be Dangerous
Knuckle Curve
LoHud Yankees Blog
Lookout Landing
Management by Baseball
Metaforian
Metsgeek
Mike's Baseball Rants
Only Baseball Matters
Redbird Nation
Red Reporter
Sabernomics (Braves)
Seth Speaks
ShysterBall
6-4-2 (Angels/Dodgers)
The Book
TheCubdom
The Cutting Edge
The House That Dewey Built
The View From The Bleachers
Tiger Blog
U.S.S. Mariner
Viva El Birdos
Where's Kernan
Minor Leagues
Arizona Fall League
BA Player Finder
Cal Leaguers
Jamey Newberg
JDM's Scoresheet Baseball
Minor League Baseball
Minor League Park Factors
Minor League Splits
No Pepper
Sickels' Minor League Ball
Warm October Nights
BA Player Finder
Cal Leaguers
Jamey Newberg
JDM's Scoresheet Baseball
Minor League Baseball
Minor League Park Factors
Minor League Splits
No Pepper
Sickels' Minor League Ball
Warm October Nights
Amateur
Boyd's World (College)
Cape Cod Baseball League
College Baseball Blog
College Baseball Insider
Collegiate Baseball Newspaper
College Splits
College Splits Blog
Dirtbags Baseball (Long Beach State)
NCAA Baseball
NCBWA
Team One Baseball (High School)
Texas A&M & Baseball
Cape Cod Baseball League
College Baseball Blog
College Baseball Insider
Collegiate Baseball Newspaper
College Splits
College Splits Blog
Dirtbags Baseball (Long Beach State)
NCAA Baseball
NCBWA
Team One Baseball (High School)
Texas A&M & Baseball
Historical
Cuban Baseball
House of David
Jim "Mudcat" Grant's Web Page
Negro League Baseball Players Assoc
Negro Leagues Baseball Museum
1919 Black Sox
Pacific Coast League
Philadelphia Athletics Historical Society
Shoeless Joe Jackson Society
SABR-L Archives
Walter O'Malley
House of David
Jim "Mudcat" Grant's Web Page
Negro League Baseball Players Assoc
Negro Leagues Baseball Museum
1919 Black Sox
Pacific Coast League
Philadelphia Athletics Historical Society
Shoeless Joe Jackson Society
SABR-L Archives
Walter O'Malley
Miscellaneous
Forums
Credits
Ticket Center
Tickets to Baseball -
Premium Red Sox Tickets - Tickets to Marlins Games - Cardinals Game Tickets - NY Yankee Tickets - Tickets Oakland Athletics - Dallas Cowboys Tickets - Arizona Cardinals Tickets - Tickets Seattle Seahawks - Buffalo Bills Tickets Online - Tickets to Dolphins Football
Buy Boston Red Sox tickets,
Philadelphia Phillies tix,
NY Yankees tickets,
NY Mets tickets, and
MLB All Star game tickets at ABC tickets
Not sure where to find the best online sportsbooks? Start your search with PlayersJet.
Get deals at SportsMemorabilia.com on baseball apparel, including Phillies jerseys and more for adults and children.
Shop the largest selection baseball equipment on sale at Sports Unlimited. Check out tons of baseball gloves, youth baseball gloves and catchers gear from Rawlings, Wilson, Nike & Under Armour.
2011 Draft Order
Courtesy of Baseball America
First-Round:
 1. Pirates (57-105)
 2. Mariners (61-101)
 3. Diamondbacks (65-97)
 4. Orioles (66-96)
 5. Royals (67-95)
 6. Nationals (69-93)
 7. Diamondbacks (for B. Loux)
 8. Indians (69-93)
 9. Cubs (75-87)
10. Padres (for Karsten Whitson)
11. Astros (76-86)
12. Brewers (77-85)
13. Mets (79-83)
14. Marlins (80-82)
15. Brewers (for Dylan Covey)
16. Dodgers (80-82)
17. Angels (80-82)
18. Athletics (81-81)
19. Red Sox (from DET for Martinez)
20. Rockies (83-79)
21. Blue Jays (85-77)
22. Cardinals (86-76)
23. Nationals (from CWS for Dunn)
24. Rays (from BOS for Crawford)
25. Padres (90-72)
26. Red Sox (from TEX for Beltre)
27. Reds (91-71)
28. Braves (91-71)
29. Giants (92-70)
30. Twins (94-68)
31. Rays (from NYY for Soriano)
32. Rays (96-66)
33. Rangers (from PHI for Lee)
Supplemental First Round:
34. Nationals (Dunn)
35. Blue Jays (Downs)
36. Red Sox (Martinez)
37. Rangers (Lee)
38. Rays (Crawford)
39. Phillies (Werth)
40. Red Sox (Beltre)
41. Rays (Soriano)
42. Rays (Balfour)
43. Diamondbacks (LaRoche)
44. Mets (Feliciano)
45. Rockies (Dotel)
46. Blue Jays (Buck)
47. White Sox (Putz)
48. Padres (Garland)
49. Giants (Uribe)
50. Twins (Hudson)
51. Yankees (Vazquez)
52. Rays (Benoit)
53. Blue Jays (Olivo)
54. Padres (Torrealba)
55. Twins (Crain)
56. Rays (Choate)
57. Blue Jays (Gregg)
58. Padres (Correia)
59. Rays (Hawpe)
| Baseball Beat | March 02, 2009 |
MLB Payroll Efficiency, 2006-2008
The Commissioner's Office released the final baseball payrolls for 2008 in late December. Not surprisingly, the New York Yankees spent $75 million more than the next highest team (Boston Red Sox) and $126 million over the average MLB team.
Last year, in an effort to analyze payroll efficiency, I created a graph with payroll on the y-axis and wins on the x-axis. I added a positively sloping trendline and four quadrants to provide a visual aid in determining the most and least efficient teams in terms of payrolls and wins.
Rob Neyer suggested that I plot this same information using multiple seasons, "as that would give us a better idea of the franchises' general competence over a period of years." With the foregoing in mind, I did just that. Thanks to data provided by Maury Brown at the Biz of Baseball, I added up the player payrolls and wins for the previous three seasons and divided them by three to get an average of each.
The two tables below detail the average payrolls and win totals, sorted by the former on the left and the latter on the right. The average payroll works out to $89.86M, which means MLB has spent an average of approximately $2.7 billion in each of the past three years (for a grand total in excess of $8 billion).
Payrolls cover the 40-man rosters and include salaries and prorated shares of signing bonuses, earned incentive bonuses, non-cash compensation, buyouts of unexercised options and cash transactions. In some cases, parts of salaries that are deferred are discounted to reflect present-day values. Luxury taxes are not part of these payroll figures nor are the posting fees for Japanese players.
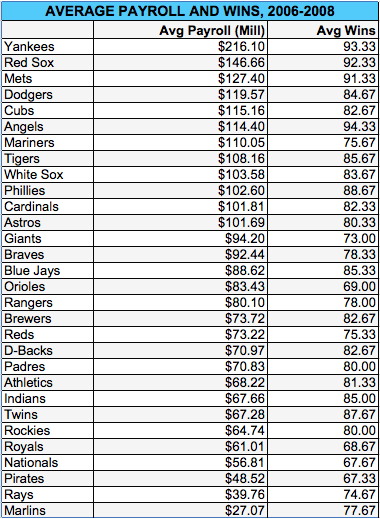
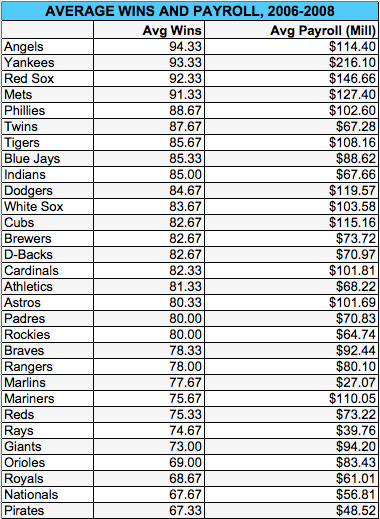
As shown, the Yankees led the majors in payroll over the 2006-2008 seasons, spending $70M more than the Red Sox and $126M over the average team. Nonetheless, the Los Angeles Angels have won more games than any other club during this same period, followed by the Yankees, Red Sox, and Mets. These four franchises were the only ones to average 90 or more victories the past three campaigns. Of note, the Bronx Bombers have spent $100M more per season than the Angels (and $305M over the three years), yet have one less win per campaign to show for their efforts. The inclusion of luxury taxes and posting fees would only widen the gap between the Yankees and the rest of the league.
The information in the tables can be displayed graphically as follows:

Based on this graph, we can once again categorize teams by the trendline and the four quadrants. Starting in the upper-right end of the graph and moving clockwise, the northeast quadrant includes teams that won more games than average with a higher-than-average payroll. The southeast quadrant depicts clubs that won more games than average with a lower-than-average payroll. The southwest quadrant includes teams that won fewer games than average with a below-average payroll. The northwest quadrant lists teams that won fewer games than average with a higher-than-average payroll.
The blue trendline indicates the positive correlation of team payroll and wins. The correlation coefficient works out to 0.64. The coefficient of determination (or R-squared) is 0.41, which means payroll explains 41 percent of a team's win total. A large portion of the balance is determined by the impact of "cost-controlled" players (i.e., minimum or close to minimum in years one through three and roughly 40-60-80 percent of free agent market values in years four through six, respectively) as Dave Studeman, who improved the correlation coefficient to 0.77 and the R-squared to nearly 0.60 for the 2006 season, pointed out in an intelligent piece in The Hardball Times a couple of years ago.
Furthermore, the relationship between payroll and wins is not linear. The difference between the highs and lows of wins (67-94) is much more tightly bunched than payrolls ($27M-$216M), suggesting that marginal wins are significantly more costly than average wins. In other words, going from 70 to 80 wins isn't as important — or costly — as going from 80 to 90 wins. By my count, 68 of the 78 teams that have won at least 90 games during the past 10 years have participated in the postseason. Win 90 and you have about an 87 percent chance of playing beyond the regular season.
Sticking to the graph, teams above the line were less efficient and teams below the line were more efficient in terms of getting the most bang for their buck. While average wins are a reasonable proxy of success, most teams are primarily focused on earning a spot in the playoffs to give them a shot at winning the World Series. Under the "flags fly forever" truism, I'm going to excuse any team that wins it all from the list of so-called inefficient teams. While the Red Sox may pay up for (part of) their success, the truth of the matter is that Boston is the only team that has won two World Series titles during the current decade. In other words, the Red Sox have been more efficient in winning World Championships than any team in baseball, not an insignificant accomplishment for a franchise that calls the AL East its home.
Aside from the Red Sox (and the Cardinals and Phillies, winners of the other two World Series in the past three seasons), which teams were the most and least efficient during the 2006-2008 time frame?
Six clubs have averaged more than 81 wins with payrolls under the league mean of $89.86M. The best of the best was Minnesota (winner of the "doing the most with the least" award), followed by Cleveland, Toronto, Arizona, Milwaukee, and Oakland. All but the Blue Jays made the playoffs once, which probably says as much about Toronto's competition as anything else.
I already cited the Phillies for winning the World Series last season but Philadelphia and the Los Angeles Angels deserve a lot of credit for payroll efficiency as well. The former captured the NL East in 2007 and 2008 and narrowly missed the playoffs in 2006, while the latter took the AL West the past two seasons but lost to the Red Sox in the ALDS both times. The Halos, lest we forget, are one of the eight clubs to have won a World Series title this decade.
Colorado, San Diego, Florida, and Tampa Bay share the award for "doing the best while pinching pennies." The Rockies (2007) and Rays (2008) made it to the World Series, while the Padres were awarded the NL West title in 2006 due to winning the season series vs. the Dodgers, the other team that won 88 games that year, and lost in a play-in game the following season. The Marlins, of course, won the World Series in 2003, the second in just a seven-year span.
The clubs in the northeast quadrant and above the trendline had mixed results. All of these teams won more than their share of games, but they did so at a cost. The Yankees are the biggest outliers by far, spending over $200M above and beyond the Red Sox with no World Series titles and only two postseason wins to show for their huge financial commitment. In fairness to the Yankees, they won a World Championship at the outset of the decade and missed out on the playoffs in 2008 for the first time since the strike-shortened season in 1994. All of the NEQ clubs made it to the playoffs at least once but only the Red Sox and Cardinals won championships.
Moving to the least efficient teams, Seattle wins the award for "doing the least with the most," while San Francisco, Atlanta, and Houston also won less than their fair share of games while sporting higher than average payrolls. In addition, Baltimore, Kansas City, and Washington spent payroll dollars unwisely during the past three years. Pittsburgh, Cincinnati, and Texas all reside on top of the trendline, meaning each team won about as many games as expected given their payrolls.
While relatively simplistic, graphing payrolls and wins — especially over a multi-year period — allows us to evaluate how efficiently ownerships and managements are spending payroll dollars.
Update: The following graph is the same as the one above except that it includes a polynomial rather than linear trendline.

The polynomial trendline improves the R-squared to .49 versus .41 for the linear. In response to a reader's question in the comments section below, I listed the regressions for each and calculated marginal wins are worth approximately $3M using the linear and range from essentially zero at the left end to as much as $7M at the right end (i.e. going from 92 to 93 wins) based on the polynomial. The bottom line is that the polynomial regression does a much better job at capturing marginal payroll and wins than the linear expression.
Comments
"In other words, the Red Sox have been more efficient in winning World Championships than any team in baseball, not an insignificant accomplishment for a franchise that calls the AL East its home."
Huh? 2 championships over 8 years (starting in 2001) at over $100mm a year -- that's well over $400mm per championship. Compared to Florida, who has 1 WS in that span and has consistently spent under $50mm (and coming from the no-slouch NL East), I'm not sure what the basis for this claim is. If the measure is $/WS, the Marlins are clearly more efficient than the Sox.
Teams 'above the line were less efficient ' -- and if you're going to make a claim about the post-season, at least do some math to support it. We all know how well the binomial behaves in samples of size 5 and 7 so supposing that an efficient team during the season (which the graph indicates the Sox were not, anyway) will behave efficiently in the post-season doesn't follow. For more, see Oakland and Minnesota.
Good article about the regular season, inaccurate post-season sidenote that is unrelated to the general line of reasoning.
Posted by: Henry Quinn at March 2, 2009 5:35 AM
Interesting data, Rich. Thanks for compiling and presenting it. Can you tell us the slope of the regression line, i.e. how much are teams paying for each marginal win?
Posted by: Guy at March 2, 2009 10:29 AM
Very nice look into this, Rich, and I think it has a lot of potential. However, I still think such an analysis is only in a fledgling stage.
The biggest flaw I see in this is that it assumes an even playing field for all teams, that teams should be compared to the whole of Major League baseball. Considering that teams play the vast majority of their games within their own league, and that intra-league schedules are unbalanced based on division, this isn't a very fair assessment.
For example, the Blue Jays place near the middle of average payroll, but can you really expect an even win return per million dollar spent by them to a team in, for example, the AL Central. I view that as a retorical question with the answer "no". I'd argue that almost every team in baseball has an innate advantage every year over the Blue Jays, so they need an handicap, a "ballpark adjustment" as it were.
Perhaps this can be done by comparing team payrolls to the weighted average of the payrolls on their schedule. I'm not well-practiced in the area of statistics, so I'm not sure how this would be done, but I think this would offer a lot more in terms of comparing teams fairly.
P.S. As a Red Sox fan, I have a selfish reason to pursue this. It's similar to how I feel it's unfair for teams to treat the Red Sox like the team with the second biggest "advantage" in baseball. In an attempt to create a quick and dirty "handicap" for the Sox, I tried this analysis: take the highest payroll team in eash division, and put those teams ahead of everyone else (because the playoff system is essentially division-based, your division is all that really matters). Then, take the remaining teams and determine what percentage of their own division-leaders payroll they spent; the smaller the percentage, the greater the payroll disadvantage that team has in making the playoffs. Not to my surprise, the Red Sox placed right in the middle of the pack in this regard (abot 14th or 15th), as they have a huge initial financial disadvantage when they try to win the division (and, of course, the other AL East teams had an even worse disadvantage...whatever handicap the Sox have, those other three undeniably have it worse).
Posted by: Peter at March 2, 2009 2:18 PM
How many championships in total and games would the Yankees need to win (annually) in order to achieve "payroll efficiency"?
It seems both numbers would have to be awfully high.
Posted by: kevinM at March 2, 2009 3:32 PM
Yankees are bad for baseball
Posted by: Jeff at March 2, 2009 6:53 PM
Thanks for this Rich. I have been looking for something like this forever.
Posted by: Joe at March 2, 2009 9:08 PM
Guy: The equation is y = 3.0844x - 159.9.
As such, each marginal win is worth about $3 million.
Plug in 81 wins and y = $89.9364M. Those two numbers are the league-wide averages.
80 wins = $86.852M ... 82 wins = $93.021M
72 wins = $62.177M ... 90 wins = $117.696M
However, as we know, the real trade-off between payroll and wins is not linear. That said, the linear regression does a pretty good job at capturing marginal victories near the mean but not as well for those incremental wins at the ends of the spectrum.
A polynomial trendline returns an R-squared of .4892 (vs. .41 for the linear trendline). Nonetheless, the following equation is a bit convoluted for my tastes: y = 0.1616x(squared) - 22.909x + 876.88.
Plugging in several numbers suggests the marginal win is worth about $3.5M near the mean but increases to $6M for the incremental win between 89 and 90, which means it does a better job of matching reality than the linear relationship.
Hope that helps.
Posted by: Rich Lederer at March 2, 2009 11:04 PM
Yankees would need to win roughly 122 games to achieve "payroll efficiency"... Ouch!
Posted by: Steve at March 2, 2009 11:55 PM
Thanks for the equations, Rich. The polynomial is definitely an improvement, and the results make sense.
Posted by: Guy at March 3, 2009 7:40 AM
I suppose this is a question of which way you want to look at it, but I was thinking of the Wins being the dependent variable (as though I were a team owner gauging how much to spend on my payroll).
Choosing one variable or the other can make a big difference in the resulting regression (because different sets of errors are being minimized). In this case, for example, the R-squared value for a least-squares linear model of Wins, regressed on Payroll is 0.407, whereas the quadratic version yields an R-squared of 0.413.
Posted by: Will Dwinnell at March 4, 2009 1:07 AM
The biggest flaw in this analysis is it assumes payroll efficiency is defined solely by the number of wins a team has (or worse, the number of championships).
By all accounts, the Yankees are a very successful business. They sell a lot of tickets and get the highest ratings of any RSN in the nation. The way there are able to sustain this model is by having a perennial playoff contender. Toward that end, the Yankees have spent significantly. Unless you can illustrate that the Yankees are not being run well as a business, you can’t state that the Yankees payroll is inefficient.
Put another way…the Yankees need to make the playoffs each year to sustain the dominance and popularity of its brand. Winning 122 games is irrelevant if 95 wins is enough to make the playoffs. I guess the Yankees could try to make the playoffs each season at a lower payroll, but I think they have correctly reasoned that overspending on their main input (player) is worth mitigating the risk that the team will not make the playoffs.
Basically, I don’t think you can look at payroll efficiency in short spans, nor can you ignore the business end. While some teams can look very efficient, if they don’t sustain their success, the long-term business gains are dissipated and the likelihood of sustained success is lessened.
Posted by: Will at March 4, 2009 6:20 AM
Rich, why not include the luxury tax? From the teams' perspective, these are just as real payroll dollars as those going to the players (and their agents). Isn't your research question concerning money spent by teams, not money earned by players?
Posted by: Ron Dufresne at March 4, 2009 7:50 AM
Good stuff, I've done a regression using just individual years a few times (different years) and it usually doesn't come up with much. Either the R^2 is small or the slope is small (ie. not significantly different from zero). I like the idea of using a 3 year average to take some of the the luck out of the equation that can go into a particular season's win total.
My one suggestion is this: Drop the Yankees and see what happens. The Yankees play by an entirely different set of rules when it comes to their budget management. I know this kind of thing is usually frowned upon in statistical analysis, but I think in this case we have a good reason to do so. Even the other ~6 "rich" teams pail in comparison to the Yankees. And if your end goal is to determine the value of a marginal win, dropping the Yankees will give you a much better idea of how much that win costs for the other 29 baseball teams. The Yankees quite obviously over pay for this win for the simple reason that they can. They are often left negotiating with themselves for the top talent. And if someone doesn't pan out, they just throw more money at someone else, while still paying the first guy his big contract to not play.
Posted by: Wally at March 4, 2009 7:56 AM
Listen to Wally's suggestion to drop the Yankees and see what happens. The Yankees are what is called an "influential outlier" - the trend looks fairly linear to me. The reason that the quadratic drives up the r^2 is b/c of the Yanks.
http://www.princeton.edu/~slynch/SOC_504/outliers.pdf
Posted by: Ryan at March 4, 2009 7:19 PM
"And if your end goal is to determine the value of a marginal win..."
I would have thought that the goal was to establish the marginal cost of a win.
Posted by: Will Dwinnell at March 5, 2009 9:31 AM
You do know that any time you add another variable to the regression, the r^2 always goes up?
Posted by: Jon at March 5, 2009 9:02 PM