Rich Lederer • Baseball Beat
Patrick Sullivan • Change-Up
Jeremy Greenhouse • Touching Bases
Dave Allen • F/X Visualizations
Sky Andrecheck • Behind the Scoreboard
Marc Hulet • Around the Minors
Al Doyle • Past Times
Retired Uniforms:
Bryan Smith • WTNY
Joe Sheehan • Command Post
Jeff Albert • The Batter's Eye
RSS Feed
Home
*Examining the Past, Present, and Future*
Lineup Card
Recent Entries
» Putting Together a Reality Team
» Historical Hall of Fame Vote Comparisons: 2012
» An All-Christmas Team
» The New-Look Angels
» John Denny: The Forgotten Cy Young Award Winner
» Money Isn't Everything
» What Would It Take to Hit .400 in the 21st Century?
» Halos Heaven
» Brandon McCarthy's Breakout Season
» Link-o-Rama
» Historical Hall of Fame Vote Comparisons: 2012
» An All-Christmas Team
» The New-Look Angels
» John Denny: The Forgotten Cy Young Award Winner
» Money Isn't Everything
» What Would It Take to Hit .400 in the 21st Century?
» Halos Heaven
» Brandon McCarthy's Breakout Season
» Link-o-Rama
Best of Baseball Beat
Abstracts From the Abstracts
1977 Baseball Abstract
1978 Baseball Abstract
1979 Baseball Abstract
1980 Baseball Abstract
1981 Baseball Abstract
1982 Baseball Abstract
1983 Baseball Abstract
1984 Baseball Abstract
1985 Baseball Abstract
1986 Baseball Abstract
1987 Baseball Abstract
1988 Baseball Abstract
1978 Baseball Abstract
1979 Baseball Abstract
1980 Baseball Abstract
1981 Baseball Abstract
1982 Baseball Abstract
1983 Baseball Abstract
1984 Baseball Abstract
1985 Baseball Abstract
1986 Baseball Abstract
1987 Baseball Abstract
1988 Baseball Abstract
Bert Blyleven Series
Meeting Up and Hanging Out with Bert
The Results Are In And...
Aficionado Heavily Invested in Blyleven
Latest on Blyleven's Chances for the HOF
The Internet Zealot Responds
400 Down and 5 to Go...
Bert Be Home By Eleven?
Blyleven's Forgotten Season (1973)
HeyMan, Your Comments Don't Hold Water
The Waiting is the Hardest Part
Another Addition to the Blyleven Series
Search for the Truth
As Dominant as His HOF Contemporaries
Listen, Buster
A Larger Step for Blyleven
Answering the Naysayers (Part Two)
Another Small Step for Blyleven
Q&A: Blyleven on the Twins
The Majority Rules, Right?
It's All Dutch to Some
The Hall of Fame Case for Bert Blyleven
Q&A: Blyleven on Felix Hernandez
Clemens Rocketing Up Charts
Poz: An Interview With a KC Star
A HOF Chat with Tracy Ringolsby
Up Close and Personal
A Peek Into the Mind of a HOF Voter
Answering the Naysayers
It's That Time of the Year (Again)
"If Cooperstown is Calling..."
The Bert Alert
One Small Step for Blyleven...
Only the Lonely
Exclusive Interviews
Lee Sinins
Alex Belth
David Pinto
Will Carroll
Mike Carminati
Aaron Gleeman
Joe Sheehan
Jay Jaffe
Jeff Peek
Tracy Ringolsby
Joe Posnanski
Bill James Part I, II, III
Jon Lalonde
Chuck Tiffany
Dayn Perry
Fay Vincent
Nate Silver
Alex Belth
David Pinto
Will Carroll
Mike Carminati
Aaron Gleeman
Joe Sheehan
Jay Jaffe
Jeff Peek
Tracy Ringolsby
Joe Posnanski
Bill James Part I, II, III
Jon Lalonde
Chuck Tiffany
Dayn Perry
Fay Vincent
Nate Silver
Bullpen
Rich Lederer
The Odd Couple (with Alex Belth)
The MostUnder Over Underrated Player in Baseball (with Brian Gunn)
Three Wise Men (roundtable by Alex Belth)
Infrequently Asked Questions (interview with Matt Welch)
Interview (Orioles Think Tank)
Bernie and the Yanks (Bronx Banter)
Hope and Faith: How the LAA Win the World Series (Baseball Prospectus)
NL West (The Soul of Baseball)
Greatest Living Hitter? (Sports Illustrated)
Roundtable: 2008 HOF Ballot (Armchair GM)
The Most
Three Wise Men (roundtable by Alex Belth)
Infrequently Asked Questions (interview with Matt Welch)
Interview (Orioles Think Tank)
Bernie and the Yanks (Bronx Banter)
Hope and Faith: How the LAA Win the World Series (Baseball Prospectus)
NL West (The Soul of Baseball)
Greatest Living Hitter? (Sports Illustrated)
Roundtable: 2008 HOF Ballot (Armchair GM)
Patrick Sullivan
Designated Hitters
David Bromberg (Q&A: John Denny)
Mark Armour (H. Killebrew and Versatility)
Joe Lederer (Soundtrack of a Prospect)
David Bromberg (Clemente's Autograph)
David Bromberg (Woody Fryman)
D. Baumstein (WAR Against Age: Pitchers)
Doug Baumstein (The WAR Against Age)
Doug Baumstein (A Lifetime on the Road)
John Fraser (Pick Six)
Mark Armour (How to Score More Runs?)
Bill Parker (What Opening Day Tells Us)
Stan Opdyke (Pat Rispole)
Chris Jaffe (Evaluating Baseball's Mgrs)
Stan Opdyke (Baseball Radio in NYC, 1953)
A. Nathan (Performance of Baseball Bats)
Michael Weddell (Edgar Martinez/HOF)
Jon Weisman (100 Things Dodgers Fans...)
Stan Opdyke (Connie Mack and Vin Scully)
Eric Walker (Evaluating Run Production)
Brent Mayne (The Intangibles of Catching)
Chris Moore (Best Fastballs in Baseball)
Dave Baldwin (The Batter’s Brain)
Shawn Haviland (Ivy League to MLB)
Larry Granillo (Walking Off)
Rob Iracane (Solo HR Won't Break You)
Tommy Bennett (Charm of AM Radio)
Harry Pavlidis (Johan Santana's Fast Start)
John Walsh (WAR and Remembrance)
Eric Walker (Precisely Inaccurate)
Bob Timmermann (As They See 'Em)
Geoff Young (Unicycles and Delusions)
Baseball Analysis at Tufts (Groundballers)
Baseball Analysis at Tufts (GB Out Rates)
G. Rybarczyk ('09 Hit Tracker Projections)
Joe Lederer (Curt Schilling/HoF)
Conor Gallagher (Hall of Fallacies)
Chris Green (Jim Rice, HoF, the Numbers)
Shawn Hoffman (Baseball's Bear Mkt?)
Paul Anthony (Manny Syndrome)
Ross Roley (World Series Odds)
B. Timmermann (Catcher's Interference)
R.J. Anderson (Waiting the Hardest Part)
Maury Brown (Cubs, MLB, and Cuban...)
Myron Logan (Dee-Fense, Dee-Fense)
Craig Calcaterra (Frivolity, Part I, Part II)
Chad Finn (Ode to Baseball Cards)
David Cameron (Mariners Foibles)
Chris Dial (Chipper Jones)
Pat Lederer (Memory Lane)
David Appelman (Clutch Pitching)
Bob Rittner (DH)
Jonathan Mayo (Roger Clemens)
Lisa Winston (My Son-in-Law...)
Russ McQueen (The Yellow Hammer)
Bob Rittner (I'm OK, You're OK)
Mark Armour (In Defense of the HOF)
Pat Jordan (Friends)
Dan Levitt (Analysis of Terry Ryan)
Doug Baumstein (Trading Econ 101)
Ross Roley (Runner's Reluctance II)
Ross Roley (Runner's Reluctance I)
Mark Armour (No-Longer Lovable Sox)
Bruce Regal (Stealthy and Wise)
Brian Gunn (Roid Monster)
Current/McEvoy (Value of the SB)
John Rickert (Sinister Thefts)
Nate Silver (Sabermetrics)
David Vincent (Home Run Production)
Joe P. Sheehan (Enhanced Gameday II)
Mark Armour (An Ode to Sport)
David Gassko (All-Time Worm Burners)
Joe P. Sheehan (Enhanced Gameday)
John Walsh (When Titans Clash)
Fox/Williams (Quantifying Coaches II)
Fox/Williams (Quantifying Coaches I)
Jacob Luft (Bull Durham Rant)
Chad Finn (Strat-O-Matic)
Lisa Winston (Rotisserie Baseball)
Dave Studeman (Baseball Stats)
Steve Treder (Roger Craig)
Marc Normandin (Jeff Bagwell)
D. Appelman (Expanding Strike Zone)
Jeff Sackmann (Worst MiL Defenders)
Jeff Sackmann (Best MiL Defenders)
Maxwell Kates (Van Lingle Mungo)
David Appelman (Pitch Location)
Kent Bonham (Danny Ray Herrera)
Glenn Stout (Two Baseball Poems)
Bruce Regal (The Challenge Round)
Mark Lamster (Barry & Ty)
Geoff Young (NL West)
Tom Lederer (The Ryan Express)
Brian Erts (Great Leap Forward)
David Pinto (Parity and the N.L.)
Jacob Luft (Fathers and Daughters)
Jamey Newberg (Pete's Sake)
Jeff Albert (A. Jones Swing Analysis)
Jeff Albert (A-Rod Swing Analysis)
Keith Law (Death, Taxes, and Waivers)
Peter Abraham (Tales of Torre Tales)
Larry Borowsky (Let 'er Rip II)
Dan Levitt (Empirical Analysis of Bunting)
Jonah Keri (If I Met Warren Cromartie...)
Bob Klapisch (War Stories)
Bob Timmermann (John F. Kennedy HS)
Kent Bonham (Aluminum Adjustments)
Al Doyle (More Than Superstars)
Ross Roley (Instant Replay)
David Vincent (Barry Bonds Homers)
Chad Finn (Our Favorite Obscurities)
Bill Deane (1979 NL MVP)
Mark Armour (Rise/Fall of Artificial Turf)
Jeff Angus (Wally Moon Camp)
David Berri (Money and Baseball)
Larry Borowsky (Baseball w/o the #s)
Derek Zumsteg (The Irrational Market)
David Regan (Free Agent Contracts)
Peter Schmuck (Steroids and the HOF)
David Appelman (Pitchers, Pitch by Pitch)
Dan Fox (Swinging, Taking, Fouling, Etc)
Patrick Sullivan (Study of NYY CF/BOS LF)
Will Leitch (Baseball Journalism)
Jeff Sullivan (Pitcher Release Points)
Steve Treder ('69-'70 Giants)
Maury Brown (Charlie Finley)
John Brattain (Bob Johnson)
Bob Klapisch (The Case for Bert Blyleven)
Jeff Peek (Pride and Prejudice)
Dayn Perry (Bert and Warren)
Rob Neyer (If Don Sutton Was Great...)
Lisa Winston (Minor League Memories)
Alex Belth (Otis Redding Was Right)
David Cameron (Long Live the King)
Jeff Angus (Baserunning Study)
Bert Blyleven (Baseball Playoffs)
Boyd Nation (Not a Prospect List)
James Click (Batters-Baserunners Study)
Jeff Shaw (Why I Love Baseball)
David Gassko (BIP/BFP Fielding Study)
Jay Jaffe (Milwaukee Sausage Race)
Jamey Newberg (Remember When)
Bob Klapisch (Press Box to the Mound)
Dan Levitt (Predictive Value of BB)
David Vincent (Official Scorer)
Jon Weisman (Rick Monday)
Larry Borowsky (Let 'er Rip)
Will Carroll (Fictional Short Story)
Bob Timmermann (Japanese Baseball)
Cyril Morong (Best Pitching Seasons)
Sean Forman (Monte Carlo Win-Loss)
Brian Gunn (My Little Blue Book)
Joe Lederer (My Dad and Baseball)
Bill Deane (Bob Gibson, 1968)
Mark Armour (1977 Yankees)
Darren Viola (Retrosheet)
David Pinto (RFK)
Dayn Perry (Brave Heart)
Matt Welch (Dave Hansen)
Kevin Kernan (Jack McKeon)
Tom Lederer (Dodgers Road Trip)
Steve Lombardi (Slider)
Studes (Picturing Baseball)
Mike Carminati (Luck of the Drawl)
Eric Neel (Vin Scully)
J.C. Bradbury (Leo Mazzone)
John Sickels (Bill James)
Search Baseball Analysts
Archives
By Category:
Around the Majors Content Only
Around the Minors Content Only
Baseball Beat Content Only
Baseball Beat/Change-Up Content Only
Baseball Beat/WTNY Content Only
Behind the Scoreboard Content Only
Change-Up Content Only
Change-Up/Around the Majors Content Only
Command Post Content Only
Crunching the Numbers Content Only
Designated Hitter Content Only
F/X Visualizations Content Only
Past Times Content Only
Saber Talk Content Only
The Batter's Eye Content Only
Touching Bases Content Only
Weekend Blog Content Only
WTNY Content Only
By Month:
February 2012
January 2012
December 2011
October 2011
September 2011
August 2011
July 2011
June 2011
May 2011
April 2011
March 2011
February 2011
January 2011
December 2010
November 2010
October 2010
September 2010
August 2010
July 2010
June 2010
May 2010
April 2010
March 2010
February 2010
January 2010
December 2009
November 2009
October 2009
September 2009
August 2009
July 2009
June 2009
May 2009
April 2009
March 2009
February 2009
January 2009
December 2008
November 2008
October 2008
September 2008
August 2008
July 2008
June 2008
May 2008
April 2008
March 2008
February 2008
January 2008
December 2007
November 2007
October 2007
September 2007
August 2007
July 2007
June 2007
May 2007
April 2007
March 2007
February 2007
January 2007
December 2006
November 2006
October 2006
September 2006
August 2006
July 2006
June 2006
May 2006
April 2006
March 2006
February 2006
January 2006
December 2005
November 2005
October 2005
September 2005
August 2005
July 2005
June 2005
May 2005
April 2005
March 2005
February 2005
January 2005
December 2004
November 2004
October 2004
September 2004
August 2004
July 2004
June 2004
May 2004
April 2004
March 2004
February 2004
January 2004
December 2003
November 2003
October 2003
September 2003
August 2003
July 2003
June 2003
Reference
Organizational Stats
Arizona Diamondbacks Bat / Pitch
Atlanta Braves Bat / Pitch
Baltimore Orioles Bat / Pitch
Boston Red Sox Bat / Pitch
Chicago Cubs Bat / Pitch
Chicago White Sox Bat / Pitch
Cincinnati Reds Bat / Pitch
Cleveland Indians Bat / Pitch
Colorado Rockies Bat / Pitch
Detroit Tigers Bat / Pitch
Florida Marlins Bat / Pitch
Houston Astros Bat / Pitch
Kansas City Royals Bat / Pitch
Los Angeles Angels Bat / Pitch
Los Angeles Dodgers Bat / Pitch
Milwaukee Brewers Bat / Pitch
Minnesota Twins Bat / Pitch
New York Mets Bat / Pitch
New York Yankees Bat / Pitch
Oakland Athletics Bat / Pitch
Philadelphia Phillies Bat / Pitch
Pittsburgh Pirates Bat / Pitch
St. Louis Cardinals Bat / Pitch
San Diego Padres Bat / Pitch
San Francisco Giants Bat / Pitch
Seattle Mariners Bat / Pitch
Tampa Bay Devil Rays Bat / Pitch
Texas Rangers Bat / Pitch
Toronto Blue Jays Bat / Pitch
Washington Nationals Bat / Pitch
All-Star Links
Official Websites
News and Notes
Baseball News Blog
Baseball Newstand
ESPN Baseball
Fox Sports Baseball
Pro Sports Daily
Roto World
The Roto Times
USA Today Baseball
Baseball Newstand
ESPN Baseball
Fox Sports Baseball
Pro Sports Daily
Roto World
The Roto Times
USA Today Baseball
Reference and Analysis
Baseball Almanac
Baseball America
Baseball Archive
Baseball Contracts
Baseball Cube
Baseball Graphs
Baseball Library
Baseball Musings Player Database
Baseball Page
Baseball Primer
Baseball Prospectus
Baseball Reference
Baseball Statistics
Baseball Truth
Boxscore Central
Diamond Mind Baseball
Doug's Stats
FanGraphs
Fast Balls (pitchfx catalog)
Hardball Dollars
Hardball Times
Hit Tracker
Retrosheet
Rotobase/Rotoblog
Stat Corner
STATS
Tango on Baseball
Yahoo Sports MLB
Web Gems
Bill James Primer
Sabermetric Manifesto (Grabiner)
Pitching and Defense (McCracken)
Pitching and Defense (Tippett)
Transactions Primer (Neyer)
Baseball Stats (Batter's Box)
Prospect Report (Cameron)
Pitcher Workloads (Sheehan)
Goodbye to Old Baseball Ideas (Rickey)
Sabermetric Manifesto (Grabiner)
Pitching and Defense (McCracken)
Pitching and Defense (Tippett)
Transactions Primer (Neyer)
Baseball Stats (Batter's Box)
Prospect Report (Cameron)
Pitcher Workloads (Sheehan)
Goodbye to Old Baseball Ideas (Rickey)
Columnists
Baseball Blogs
Around the Majors
Athletics Nation
Baseball Crank
Baseball Musings
Baseball-Reference Blog
Batter's Box
Big League Stew
Bronx Banter
Catfish Stew
Cub Town
Dan Agonistes
Dodger Thoughts
DRays Bay
Ducksnorts
Futility Infielder
Halos Heaven
Inside the Rockies
It Might Be Dangerous
Knuckle Curve
LoHud Yankees Blog
Lookout Landing
Management by Baseball
Metaforian
Metsgeek
Mike's Baseball Rants
Only Baseball Matters
Redbird Nation
Red Reporter
Sabernomics (Braves)
Seth Speaks
ShysterBall
6-4-2 (Angels/Dodgers)
The Book
TheCubdom
The Cutting Edge
The House That Dewey Built
The View From The Bleachers
Tiger Blog
U.S.S. Mariner
Viva El Birdos
Where's Kernan
Minor Leagues
Arizona Fall League
BA Player Finder
Cal Leaguers
Jamey Newberg
JDM's Scoresheet Baseball
Minor League Baseball
Minor League Park Factors
Minor League Splits
No Pepper
Sickels' Minor League Ball
Warm October Nights
BA Player Finder
Cal Leaguers
Jamey Newberg
JDM's Scoresheet Baseball
Minor League Baseball
Minor League Park Factors
Minor League Splits
No Pepper
Sickels' Minor League Ball
Warm October Nights
Amateur
Boyd's World (College)
Cape Cod Baseball League
College Baseball Blog
College Baseball Insider
Collegiate Baseball Newspaper
College Splits
College Splits Blog
Dirtbags Baseball (Long Beach State)
NCAA Baseball
NCBWA
Team One Baseball (High School)
Texas A&M & Baseball
Cape Cod Baseball League
College Baseball Blog
College Baseball Insider
Collegiate Baseball Newspaper
College Splits
College Splits Blog
Dirtbags Baseball (Long Beach State)
NCAA Baseball
NCBWA
Team One Baseball (High School)
Texas A&M & Baseball
Historical
Cuban Baseball
House of David
Jim "Mudcat" Grant's Web Page
Negro League Baseball Players Assoc
Negro Leagues Baseball Museum
1919 Black Sox
Pacific Coast League
Philadelphia Athletics Historical Society
Shoeless Joe Jackson Society
SABR-L Archives
Walter O'Malley
House of David
Jim "Mudcat" Grant's Web Page
Negro League Baseball Players Assoc
Negro Leagues Baseball Museum
1919 Black Sox
Pacific Coast League
Philadelphia Athletics Historical Society
Shoeless Joe Jackson Society
SABR-L Archives
Walter O'Malley
Miscellaneous
Forums
Credits
Ticket Center
Tickets to Baseball -
Premium Red Sox Tickets - Tickets to Marlins Games - Cardinals Game Tickets - NY Yankee Tickets - Tickets Oakland Athletics - Dallas Cowboys Tickets - Arizona Cardinals Tickets - Tickets Seattle Seahawks - Buffalo Bills Tickets Online - Tickets to Dolphins Football
Buy Boston Red Sox tickets,
Philadelphia Phillies tix,
NY Yankees tickets,
NY Mets tickets, and
MLB All Star game tickets at ABC tickets
Not sure where to find the best online sportsbooks? Start your search with PlayersJet.
Get deals at SportsMemorabilia.com on baseball apparel, including Phillies jerseys and more for adults and children.
Shop the largest selection baseball equipment on sale at Sports Unlimited. Check out tons of baseball gloves, youth baseball gloves and catchers gear from Rawlings, Wilson, Nike & Under Armour.
2011 Draft Order
Courtesy of Baseball America
First-Round:
 1. Pirates (57-105)
 2. Mariners (61-101)
 3. Diamondbacks (65-97)
 4. Orioles (66-96)
 5. Royals (67-95)
 6. Nationals (69-93)
 7. Diamondbacks (for B. Loux)
 8. Indians (69-93)
 9. Cubs (75-87)
10. Padres (for Karsten Whitson)
11. Astros (76-86)
12. Brewers (77-85)
13. Mets (79-83)
14. Marlins (80-82)
15. Brewers (for Dylan Covey)
16. Dodgers (80-82)
17. Angels (80-82)
18. Athletics (81-81)
19. Red Sox (from DET for Martinez)
20. Rockies (83-79)
21. Blue Jays (85-77)
22. Cardinals (86-76)
23. Nationals (from CWS for Dunn)
24. Rays (from BOS for Crawford)
25. Padres (90-72)
26. Red Sox (from TEX for Beltre)
27. Reds (91-71)
28. Braves (91-71)
29. Giants (92-70)
30. Twins (94-68)
31. Rays (from NYY for Soriano)
32. Rays (96-66)
33. Rangers (from PHI for Lee)
Supplemental First Round:
34. Nationals (Dunn)
35. Blue Jays (Downs)
36. Red Sox (Martinez)
37. Rangers (Lee)
38. Rays (Crawford)
39. Phillies (Werth)
40. Red Sox (Beltre)
41. Rays (Soriano)
42. Rays (Balfour)
43. Diamondbacks (LaRoche)
44. Mets (Feliciano)
45. Rockies (Dotel)
46. Blue Jays (Buck)
47. White Sox (Putz)
48. Padres (Garland)
49. Giants (Uribe)
50. Twins (Hudson)
51. Yankees (Vazquez)
52. Rays (Benoit)
53. Blue Jays (Olivo)
54. Padres (Torrealba)
55. Twins (Crain)
56. Rays (Choate)
57. Blue Jays (Gregg)
58. Padres (Correia)
59. Rays (Hawpe)
| Behind the Scoreboard | November 24, 2009 |
MVP Award Probabilities: Accounting for Sampling Variation
This week wraps up the MLB awards. In the AL, Joe Mauer took home the MVP and Zack Greinke took home the Cy Young. In the NL, the hardware will likely go to Albert Pujols for MVP. Meanwhile, in one of the tightest three-way races in recent memory, Tim Lincecum squeaked out a victory for the Cy Young. Since these four players won the awards, they must be the top players of 2009, right?
Surely, I jest. If you’re reading this, you probably have figured out long ago that the Baseball Writers Association of America does not always award the MVP and Cy Young to the most productive or valuable players (this year, however I happen to agree with all four of their picks). However, even making the quantum leap that the BBWAA is the population most qualified to determine the winners of these awards, there is still no guarantee that the small group of writers who actually get to vote for the awards will accurately mirror the opinions of the group they represent. The reason: simple statistical sampling variability. If we consider the actual voters as a simple sample of 32 voters (or 28 in the AL) who represent a hypothetical universe of similarly qualified baseball writers, analysts, and experts, we can see that there is natural variability in the votes of the MVP and Cy Young, and that the “right” player (defined as the consensus pick among the entire universe of qualified baseball experts) may not always be chosen.
On the basis of the 32 BBWAA writers’ votes, Tim Lincecum was deemed the best pitcher of 2009 by the baseball establishment. But was Lincecum’s really the consensus pick for the NL Cy Young? Or did Lincecum just get lucky while the majority of qualified experts really preferred somebody else? Based on the results of the voting, it’s clear that some baseball experts preferred Lincecum (11 first-place votes), some preferred Wainwright (9 first-place votes), and some preferred Carpenter (12 first-place votes). When the Cy Young votes were tallied, the group of 32 voters as a whole preferred Lincecum, but it was very close. Perhaps Lincecum simply got lucky and, just by chance, had more of his supporters in the sample of 32 voters. Perhaps the universe of qualified baseball experts as a whole actually thought Carpenter or Wainwright was most deserving of the award.
This article attempts to find the probability that Lincecum really did have the most support among the baseball establishment, and that the 32 voters who happened to have a vote this year really did select the “right” candidate.
Calculating the Probabilities
One way to estimate the variability associated with the MVP and Cy Young awards is to use a statistical resampling method, in which you basically take a sample of the 32 ballots with replacement. This method of essentially simulating the MVP balloting many times based upon the real MVP balloting would be great, except for one snafu: it appears very difficult, if not impossible, to find the results of each individual ballot. Without having the individual ballots, we can’t use this technique.
In the end I settled on a different kind of approach. To start with, I calculated both the mean and standard deviation of each player’s point total. I then used the normal distribution (which is applicable due to the Central Limit Theorem) to determine how likely it was that a player, given a certain “true” expected point total, would have scored as many points as he actually did in the Award voting. For instance, if Lincecum’s true expected Cy Young point total among the universe of all writers was 90, what was the probability that he would have scored the exactly the 100 points that he actually scored? In this case, about 2.4%. How about if Lincecum’s true average was 91? As expected, it's a little higher, at 2.7%. We do this for every potential “true” expected value of Lincecum’s point total.
In the end, we want to determine the probability that Lincecum’s “true” expected point value was the highest of all the Cy Young contenders? The problem of course is that Lincecum’s point total is highly correlated with the other contenders, so we can’t use assume independence among each pitchers to determine this probability. Furthermore determining the exact correlation between two players’ point totals is very difficult.
Instead, what we can do is estimate a point total required for victory, and calculate the odds of each player having a true value greater or equal to this necessary total. In a two-person race, this necessary total is usually simply half-way between the winner and the runner-up’s point total. In a three-way or other type of race, the number is a little trickier to figure. In the end, we can determine expected point value necessary to win by choosing the value for which the sum of all players’ probability totals 100%. For example in the 2009 Rookie of the Year voting, the points “necessary for victory” was 100. The probability that Chris Coughlin, who actually scored 105 points with a standard error of about 12 points, had a “true” expected point value of 100 points or higher was 70%. For J.A. Happ, who scored 94 points, the probability of having a true point value of 100 or higher was just 30%. This means that based on the sample of 32 votes, there was a 70% chance that Coghlan really was the consensus choice for Rookie of the Year among a greater universe of voters, and a 30% chance that Coghlan just lucked into the award and that Happ actually had more support among all potential voters.
The 2009 Awards
How did the rest of the awards go? In the AL MVP, Joe Mauer won 27 out of 28 first place votes and crushed Mark Teixeira with a point total of 387 to 225. In this case there was little doubt that the baseball writers as a whole preferred Mauer as the AL MVP, and this method shows Mauer with a virtually 100% chance of being the “true” writer’s choice. The same was true with the AL Cy Young, where Zack Greinke was almost certainly the writers' choice for the award.
In the NL however, things went much differently. Lincecum scored 100 points and was the winner of the Cy Young. Carpenter scored 94 points, while Wainwright scored 90 points. If just a handful of voters had switched his first-place vote from Lincecum to either Carpenter or Wainwright, the outcome would have been different. So, what was the probability that Lincecum was truly the choice of the baseball writers as a whole? Lincecum scored 100 points with a standard error of 9.2 points. Carpenter scored 94 points with a standard error of 9.2 points, while Wainwright scored 90 points, with a slightly higher standard error of 10.5 points.
So what was the probability that each pitcher’s true point value was greater than the roughly 99 points that were required to win the award? Lincecum had a 53% chance of having a true expected point total above 99. Carpenter had a 28% chance, and Wainwright had a 19% chance. This analysis shows that because there were only 32 voters in such a close vote, the true writers’ choice could have been any of the three. In the end, Lincecum was the lucky one, in garnering the most support from the 32 writers that actually had a vote. However, there is only a 53% chance that Lincecum had the most support from the hypothetical universe of all expert baseball writers. Carpenter or Wainwright may have been the ones who actually “deserved” the award. However, because MLB only surveys 32 writers, we’ll never know who the greater universe of writers’ true choice was.
Looking at the Rookie of the Year voting, we see similar uncertainty. The AL Rookie of the Year vote was fairly close, with Andrew Bailey winning 13 of 28 first place votes and winning by the margin of 88-65 over Elvis Andrus and Ricky Porcello. However, because of the small sample size, it’s no guarantee that Bailey truly had the writers' backing. There was an 80% chance that Bailey was the true choice, however Andrus and Porcello also may have been the true RoY winners, with an 11% and 9% chance respectively. Meanwhile the NL Rookie voting was a 70%-30% split as I mentioned previously.
Probability of Being the True MVP/Cy Young/RoY 2003-2009
Below you can see the probability of being the “true” MVP, Cy Young, and Rookie of the Year for each league over the several years.
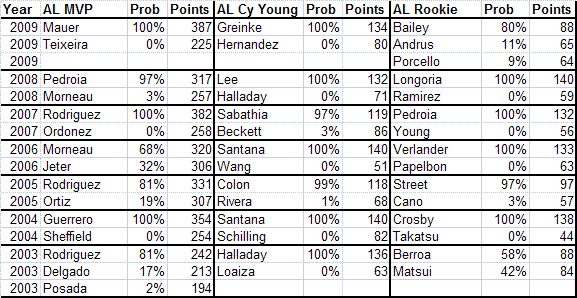
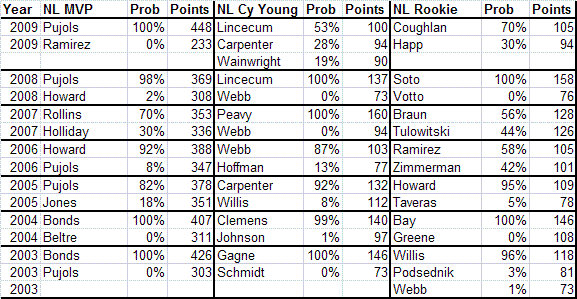
As you can see from the chart, many MVP and Cy Young Award winners were not certain winners. Had a different set of writers been voting, things might have turned out differently. As a general rule, one cannot be sure that the MVP has been selected "correctly" unless one candidate has about a 70 point lead in the voting. For instance, in 2008, Albert Pujols garnered 18 first-place votes and bested Ryan Howard by 61 points in the voting. However, there was still a 2% chance that Albert won by luck and that Ryan Howard was the true writers choice for MVP. A win of 40 points means that the winner had about a 90% likelihood of being the “true” MVP. Meanwhile a win of 20 points corresponds to about a 75% probability of being the true consensus selection.
In the Cy Young or Rookie of the Year, the margins required are not as steep. A 50-point lead or more virtually guarantees that the right person got the award. A 20-point lead means that the winner had about a 90% chance of being the true consensus pick, a 10-point lead corresponds to a 70% probability, while a 5-point lead corresponds to about a 60% probability.
MVP Award Probability vs. MVP Award Shares
This system, which I'll call MVP Award Probabilities is an alternative to the “MVP Award Shares” statistic, though they really measure seperate things. In that system, a player is given award shares even when it is clear that there was absolutely no chance that he was considered the most valuable player by the writers. For example, Mark Teixeira had an MVP award share of 57% this year, despite getting no first place votes and being undeniably NOT considered the best player in the AL by the BBWAA. Additionally, players can have very similar award shares even when it is fairly clear that one player was the consensus pick. For example, in the 2008 NL MVP race, Albert Pujols had a 98% chance of being the “true” MVP, but the difference in award shares was not very great (82% to 69%).
This Award Probability system also has the advantage of handing out exactly one award - if you sum the award probability percentages, they add to exactly 100%. With this method, we can give Albert Pujols 98% of an MVP and Ryan Howard 2% of an MVP in the 2008 race. Though Howard certainly had some support among the writers for MVP, it was fairly clear that the consensus choice was Pujols, hence we give him credit for nearly an entire MVP award. In the case of the 2009 Cy Young Award, even though Lincecum won the award, there was only about a 50% chance that he “deserved” it. Hence, we can award him about 50% of a Cy Young Award. This, in contrast to 2008, when Lincecum was clearly the Cy Young choice of the writers over Brandon Webb.
In the end, these Award Probabilities are useful for giving out partial awards in years when there was no consensus award winner. Because the sample size of voters is quite small, often we can't be sure who really had biggest backing of baseball experts. Calculating these probabilities is an interesting way of accounting for this uncertainty.
Comments
Interesting idea. I wonder if there is another factor. Some writers might want to give a guy 4.5 and another 3.5 instead of 5 & 3 (if you said something like this in the article I missed it). They are each constrained to give a certain point total that may not reflect their true preferences.
Posted by: Cyril Morong at November 24, 2009 10:52 AM
You guys that make up or follow formulas should put your skills to use trying to do something relevant to help the country instead of wasting your talents on silly baseball stuff. Baseball players aren't machine or robots.
Posted by: Al Einstein at November 25, 2009 10:30 AM
Anyone have theory on how Lincecum can finish behind Carpenter and Wainwright yet beat them for the Cy Young award?
Posted by: Cyril Morong at November 25, 2009 3:37 PM
Cyril,
Lincecum won because he had more second place votes than Carpenter. This catapulted him into the lead even though Carpenter had more first place votes.
Posted by: Sky Andrecheck at November 25, 2009 3:53 PM
I meant how he could finish behind each of them in the MVP voting yet beat them in the Cy Young. I should have said that. Carpenter had a 5th place vote for MVP and two 6th place votes while Linceum's best vote was 7th. Wainwright also had a 5th place vote.
Posted by: Cyril Morong at November 25, 2009 4:00 PM
The MVP and Cy Young Award do not have the same group of voters. As such, it's not particularly surprising when an inconsistency that like appears, especially considering the small sample size involved. Secondly, rightly or wrongly, the MVP vote has generally favored players on teams that qualify for the postseason, which would perhaps explain why Carpenter and Wainwright finished ahead of Lincecum for MVP.
Posted by: Rich Lederer at November 26, 2009 9:27 AM
Rich
Thanks. How is it determined then who gets to vote on which award?
Cy
Posted by: Cyril Morong at November 27, 2009 6:25 AM