Rich Lederer • Baseball Beat
Patrick Sullivan • Change-Up
Jeremy Greenhouse • Touching Bases
Dave Allen • F/X Visualizations
Sky Andrecheck • Behind the Scoreboard
Marc Hulet • Around the Minors
Al Doyle • Past Times
Retired Uniforms:
Bryan Smith • WTNY
Joe Sheehan • Command Post
Jeff Albert • The Batter's Eye
RSS Feed
Home
*Examining the Past, Present, and Future*
Lineup Card
Recent Entries
» Putting Together a Reality Team
» Historical Hall of Fame Vote Comparisons: 2012
» An All-Christmas Team
» The New-Look Angels
» John Denny: The Forgotten Cy Young Award Winner
» Money Isn't Everything
» What Would It Take to Hit .400 in the 21st Century?
» Halos Heaven
» Brandon McCarthy's Breakout Season
» Link-o-Rama
» Historical Hall of Fame Vote Comparisons: 2012
» An All-Christmas Team
» The New-Look Angels
» John Denny: The Forgotten Cy Young Award Winner
» Money Isn't Everything
» What Would It Take to Hit .400 in the 21st Century?
» Halos Heaven
» Brandon McCarthy's Breakout Season
» Link-o-Rama
Best of Baseball Beat
Abstracts From the Abstracts
1977 Baseball Abstract
1978 Baseball Abstract
1979 Baseball Abstract
1980 Baseball Abstract
1981 Baseball Abstract
1982 Baseball Abstract
1983 Baseball Abstract
1984 Baseball Abstract
1985 Baseball Abstract
1986 Baseball Abstract
1987 Baseball Abstract
1988 Baseball Abstract
1978 Baseball Abstract
1979 Baseball Abstract
1980 Baseball Abstract
1981 Baseball Abstract
1982 Baseball Abstract
1983 Baseball Abstract
1984 Baseball Abstract
1985 Baseball Abstract
1986 Baseball Abstract
1987 Baseball Abstract
1988 Baseball Abstract
Bert Blyleven Series
Meeting Up and Hanging Out with Bert
The Results Are In And...
Aficionado Heavily Invested in Blyleven
Latest on Blyleven's Chances for the HOF
The Internet Zealot Responds
400 Down and 5 to Go...
Bert Be Home By Eleven?
Blyleven's Forgotten Season (1973)
HeyMan, Your Comments Don't Hold Water
The Waiting is the Hardest Part
Another Addition to the Blyleven Series
Search for the Truth
As Dominant as His HOF Contemporaries
Listen, Buster
A Larger Step for Blyleven
Answering the Naysayers (Part Two)
Another Small Step for Blyleven
Q&A: Blyleven on the Twins
The Majority Rules, Right?
It's All Dutch to Some
The Hall of Fame Case for Bert Blyleven
Q&A: Blyleven on Felix Hernandez
Clemens Rocketing Up Charts
Poz: An Interview With a KC Star
A HOF Chat with Tracy Ringolsby
Up Close and Personal
A Peek Into the Mind of a HOF Voter
Answering the Naysayers
It's That Time of the Year (Again)
"If Cooperstown is Calling..."
The Bert Alert
One Small Step for Blyleven...
Only the Lonely
Exclusive Interviews
Lee Sinins
Alex Belth
David Pinto
Will Carroll
Mike Carminati
Aaron Gleeman
Joe Sheehan
Jay Jaffe
Jeff Peek
Tracy Ringolsby
Joe Posnanski
Bill James Part I, II, III
Jon Lalonde
Chuck Tiffany
Dayn Perry
Fay Vincent
Nate Silver
Alex Belth
David Pinto
Will Carroll
Mike Carminati
Aaron Gleeman
Joe Sheehan
Jay Jaffe
Jeff Peek
Tracy Ringolsby
Joe Posnanski
Bill James Part I, II, III
Jon Lalonde
Chuck Tiffany
Dayn Perry
Fay Vincent
Nate Silver
Bullpen
Rich Lederer
The Odd Couple (with Alex Belth)
The MostUnder Over Underrated Player in Baseball (with Brian Gunn)
Three Wise Men (roundtable by Alex Belth)
Infrequently Asked Questions (interview with Matt Welch)
Interview (Orioles Think Tank)
Bernie and the Yanks (Bronx Banter)
Hope and Faith: How the LAA Win the World Series (Baseball Prospectus)
NL West (The Soul of Baseball)
Greatest Living Hitter? (Sports Illustrated)
Roundtable: 2008 HOF Ballot (Armchair GM)
The Most
Three Wise Men (roundtable by Alex Belth)
Infrequently Asked Questions (interview with Matt Welch)
Interview (Orioles Think Tank)
Bernie and the Yanks (Bronx Banter)
Hope and Faith: How the LAA Win the World Series (Baseball Prospectus)
NL West (The Soul of Baseball)
Greatest Living Hitter? (Sports Illustrated)
Roundtable: 2008 HOF Ballot (Armchair GM)
Patrick Sullivan
Designated Hitters
David Bromberg (Q&A: John Denny)
Mark Armour (H. Killebrew and Versatility)
Joe Lederer (Soundtrack of a Prospect)
David Bromberg (Clemente's Autograph)
David Bromberg (Woody Fryman)
D. Baumstein (WAR Against Age: Pitchers)
Doug Baumstein (The WAR Against Age)
Doug Baumstein (A Lifetime on the Road)
John Fraser (Pick Six)
Mark Armour (How to Score More Runs?)
Bill Parker (What Opening Day Tells Us)
Stan Opdyke (Pat Rispole)
Chris Jaffe (Evaluating Baseball's Mgrs)
Stan Opdyke (Baseball Radio in NYC, 1953)
A. Nathan (Performance of Baseball Bats)
Michael Weddell (Edgar Martinez/HOF)
Jon Weisman (100 Things Dodgers Fans...)
Stan Opdyke (Connie Mack and Vin Scully)
Eric Walker (Evaluating Run Production)
Brent Mayne (The Intangibles of Catching)
Chris Moore (Best Fastballs in Baseball)
Dave Baldwin (The Batter’s Brain)
Shawn Haviland (Ivy League to MLB)
Larry Granillo (Walking Off)
Rob Iracane (Solo HR Won't Break You)
Tommy Bennett (Charm of AM Radio)
Harry Pavlidis (Johan Santana's Fast Start)
John Walsh (WAR and Remembrance)
Eric Walker (Precisely Inaccurate)
Bob Timmermann (As They See 'Em)
Geoff Young (Unicycles and Delusions)
Baseball Analysis at Tufts (Groundballers)
Baseball Analysis at Tufts (GB Out Rates)
G. Rybarczyk ('09 Hit Tracker Projections)
Joe Lederer (Curt Schilling/HoF)
Conor Gallagher (Hall of Fallacies)
Chris Green (Jim Rice, HoF, the Numbers)
Shawn Hoffman (Baseball's Bear Mkt?)
Paul Anthony (Manny Syndrome)
Ross Roley (World Series Odds)
B. Timmermann (Catcher's Interference)
R.J. Anderson (Waiting the Hardest Part)
Maury Brown (Cubs, MLB, and Cuban...)
Myron Logan (Dee-Fense, Dee-Fense)
Craig Calcaterra (Frivolity, Part I, Part II)
Chad Finn (Ode to Baseball Cards)
David Cameron (Mariners Foibles)
Chris Dial (Chipper Jones)
Pat Lederer (Memory Lane)
David Appelman (Clutch Pitching)
Bob Rittner (DH)
Jonathan Mayo (Roger Clemens)
Lisa Winston (My Son-in-Law...)
Russ McQueen (The Yellow Hammer)
Bob Rittner (I'm OK, You're OK)
Mark Armour (In Defense of the HOF)
Pat Jordan (Friends)
Dan Levitt (Analysis of Terry Ryan)
Doug Baumstein (Trading Econ 101)
Ross Roley (Runner's Reluctance II)
Ross Roley (Runner's Reluctance I)
Mark Armour (No-Longer Lovable Sox)
Bruce Regal (Stealthy and Wise)
Brian Gunn (Roid Monster)
Current/McEvoy (Value of the SB)
John Rickert (Sinister Thefts)
Nate Silver (Sabermetrics)
David Vincent (Home Run Production)
Joe P. Sheehan (Enhanced Gameday II)
Mark Armour (An Ode to Sport)
David Gassko (All-Time Worm Burners)
Joe P. Sheehan (Enhanced Gameday)
John Walsh (When Titans Clash)
Fox/Williams (Quantifying Coaches II)
Fox/Williams (Quantifying Coaches I)
Jacob Luft (Bull Durham Rant)
Chad Finn (Strat-O-Matic)
Lisa Winston (Rotisserie Baseball)
Dave Studeman (Baseball Stats)
Steve Treder (Roger Craig)
Marc Normandin (Jeff Bagwell)
D. Appelman (Expanding Strike Zone)
Jeff Sackmann (Worst MiL Defenders)
Jeff Sackmann (Best MiL Defenders)
Maxwell Kates (Van Lingle Mungo)
David Appelman (Pitch Location)
Kent Bonham (Danny Ray Herrera)
Glenn Stout (Two Baseball Poems)
Bruce Regal (The Challenge Round)
Mark Lamster (Barry & Ty)
Geoff Young (NL West)
Tom Lederer (The Ryan Express)
Brian Erts (Great Leap Forward)
David Pinto (Parity and the N.L.)
Jacob Luft (Fathers and Daughters)
Jamey Newberg (Pete's Sake)
Jeff Albert (A. Jones Swing Analysis)
Jeff Albert (A-Rod Swing Analysis)
Keith Law (Death, Taxes, and Waivers)
Peter Abraham (Tales of Torre Tales)
Larry Borowsky (Let 'er Rip II)
Dan Levitt (Empirical Analysis of Bunting)
Jonah Keri (If I Met Warren Cromartie...)
Bob Klapisch (War Stories)
Bob Timmermann (John F. Kennedy HS)
Kent Bonham (Aluminum Adjustments)
Al Doyle (More Than Superstars)
Ross Roley (Instant Replay)
David Vincent (Barry Bonds Homers)
Chad Finn (Our Favorite Obscurities)
Bill Deane (1979 NL MVP)
Mark Armour (Rise/Fall of Artificial Turf)
Jeff Angus (Wally Moon Camp)
David Berri (Money and Baseball)
Larry Borowsky (Baseball w/o the #s)
Derek Zumsteg (The Irrational Market)
David Regan (Free Agent Contracts)
Peter Schmuck (Steroids and the HOF)
David Appelman (Pitchers, Pitch by Pitch)
Dan Fox (Swinging, Taking, Fouling, Etc)
Patrick Sullivan (Study of NYY CF/BOS LF)
Will Leitch (Baseball Journalism)
Jeff Sullivan (Pitcher Release Points)
Steve Treder ('69-'70 Giants)
Maury Brown (Charlie Finley)
John Brattain (Bob Johnson)
Bob Klapisch (The Case for Bert Blyleven)
Jeff Peek (Pride and Prejudice)
Dayn Perry (Bert and Warren)
Rob Neyer (If Don Sutton Was Great...)
Lisa Winston (Minor League Memories)
Alex Belth (Otis Redding Was Right)
David Cameron (Long Live the King)
Jeff Angus (Baserunning Study)
Bert Blyleven (Baseball Playoffs)
Boyd Nation (Not a Prospect List)
James Click (Batters-Baserunners Study)
Jeff Shaw (Why I Love Baseball)
David Gassko (BIP/BFP Fielding Study)
Jay Jaffe (Milwaukee Sausage Race)
Jamey Newberg (Remember When)
Bob Klapisch (Press Box to the Mound)
Dan Levitt (Predictive Value of BB)
David Vincent (Official Scorer)
Jon Weisman (Rick Monday)
Larry Borowsky (Let 'er Rip)
Will Carroll (Fictional Short Story)
Bob Timmermann (Japanese Baseball)
Cyril Morong (Best Pitching Seasons)
Sean Forman (Monte Carlo Win-Loss)
Brian Gunn (My Little Blue Book)
Joe Lederer (My Dad and Baseball)
Bill Deane (Bob Gibson, 1968)
Mark Armour (1977 Yankees)
Darren Viola (Retrosheet)
David Pinto (RFK)
Dayn Perry (Brave Heart)
Matt Welch (Dave Hansen)
Kevin Kernan (Jack McKeon)
Tom Lederer (Dodgers Road Trip)
Steve Lombardi (Slider)
Studes (Picturing Baseball)
Mike Carminati (Luck of the Drawl)
Eric Neel (Vin Scully)
J.C. Bradbury (Leo Mazzone)
John Sickels (Bill James)
Search Baseball Analysts
Archives
By Category:
Around the Majors Content Only
Around the Minors Content Only
Baseball Beat Content Only
Baseball Beat/Change-Up Content Only
Baseball Beat/WTNY Content Only
Behind the Scoreboard Content Only
Change-Up Content Only
Change-Up/Around the Majors Content Only
Command Post Content Only
Crunching the Numbers Content Only
Designated Hitter Content Only
F/X Visualizations Content Only
Past Times Content Only
Saber Talk Content Only
The Batter's Eye Content Only
Touching Bases Content Only
Weekend Blog Content Only
WTNY Content Only
By Month:
February 2012
January 2012
December 2011
October 2011
September 2011
August 2011
July 2011
June 2011
May 2011
April 2011
March 2011
February 2011
January 2011
December 2010
November 2010
October 2010
September 2010
August 2010
July 2010
June 2010
May 2010
April 2010
March 2010
February 2010
January 2010
December 2009
November 2009
October 2009
September 2009
August 2009
July 2009
June 2009
May 2009
April 2009
March 2009
February 2009
January 2009
December 2008
November 2008
October 2008
September 2008
August 2008
July 2008
June 2008
May 2008
April 2008
March 2008
February 2008
January 2008
December 2007
November 2007
October 2007
September 2007
August 2007
July 2007
June 2007
May 2007
April 2007
March 2007
February 2007
January 2007
December 2006
November 2006
October 2006
September 2006
August 2006
July 2006
June 2006
May 2006
April 2006
March 2006
February 2006
January 2006
December 2005
November 2005
October 2005
September 2005
August 2005
July 2005
June 2005
May 2005
April 2005
March 2005
February 2005
January 2005
December 2004
November 2004
October 2004
September 2004
August 2004
July 2004
June 2004
May 2004
April 2004
March 2004
February 2004
January 2004
December 2003
November 2003
October 2003
September 2003
August 2003
July 2003
June 2003
Reference
Organizational Stats
Arizona Diamondbacks Bat / Pitch
Atlanta Braves Bat / Pitch
Baltimore Orioles Bat / Pitch
Boston Red Sox Bat / Pitch
Chicago Cubs Bat / Pitch
Chicago White Sox Bat / Pitch
Cincinnati Reds Bat / Pitch
Cleveland Indians Bat / Pitch
Colorado Rockies Bat / Pitch
Detroit Tigers Bat / Pitch
Florida Marlins Bat / Pitch
Houston Astros Bat / Pitch
Kansas City Royals Bat / Pitch
Los Angeles Angels Bat / Pitch
Los Angeles Dodgers Bat / Pitch
Milwaukee Brewers Bat / Pitch
Minnesota Twins Bat / Pitch
New York Mets Bat / Pitch
New York Yankees Bat / Pitch
Oakland Athletics Bat / Pitch
Philadelphia Phillies Bat / Pitch
Pittsburgh Pirates Bat / Pitch
St. Louis Cardinals Bat / Pitch
San Diego Padres Bat / Pitch
San Francisco Giants Bat / Pitch
Seattle Mariners Bat / Pitch
Tampa Bay Devil Rays Bat / Pitch
Texas Rangers Bat / Pitch
Toronto Blue Jays Bat / Pitch
Washington Nationals Bat / Pitch
All-Star Links
Official Websites
News and Notes
Baseball News Blog
Baseball Newstand
ESPN Baseball
Fox Sports Baseball
Pro Sports Daily
Roto World
The Roto Times
USA Today Baseball
Baseball Newstand
ESPN Baseball
Fox Sports Baseball
Pro Sports Daily
Roto World
The Roto Times
USA Today Baseball
Reference and Analysis
Baseball Almanac
Baseball America
Baseball Archive
Baseball Contracts
Baseball Cube
Baseball Graphs
Baseball Library
Baseball Musings Player Database
Baseball Page
Baseball Primer
Baseball Prospectus
Baseball Reference
Baseball Statistics
Baseball Truth
Boxscore Central
Diamond Mind Baseball
Doug's Stats
FanGraphs
Fast Balls (pitchfx catalog)
Hardball Dollars
Hardball Times
Hit Tracker
Retrosheet
Rotobase/Rotoblog
Stat Corner
STATS
Tango on Baseball
Yahoo Sports MLB
Web Gems
Bill James Primer
Sabermetric Manifesto (Grabiner)
Pitching and Defense (McCracken)
Pitching and Defense (Tippett)
Transactions Primer (Neyer)
Baseball Stats (Batter's Box)
Prospect Report (Cameron)
Pitcher Workloads (Sheehan)
Goodbye to Old Baseball Ideas (Rickey)
Sabermetric Manifesto (Grabiner)
Pitching and Defense (McCracken)
Pitching and Defense (Tippett)
Transactions Primer (Neyer)
Baseball Stats (Batter's Box)
Prospect Report (Cameron)
Pitcher Workloads (Sheehan)
Goodbye to Old Baseball Ideas (Rickey)
Columnists
Baseball Blogs
Around the Majors
Athletics Nation
Baseball Crank
Baseball Musings
Baseball-Reference Blog
Batter's Box
Big League Stew
Bronx Banter
Catfish Stew
Cub Town
Dan Agonistes
Dodger Thoughts
DRays Bay
Ducksnorts
Futility Infielder
Halos Heaven
Inside the Rockies
It Might Be Dangerous
Knuckle Curve
LoHud Yankees Blog
Lookout Landing
Management by Baseball
Metaforian
Metsgeek
Mike's Baseball Rants
Only Baseball Matters
Redbird Nation
Red Reporter
Sabernomics (Braves)
Seth Speaks
ShysterBall
6-4-2 (Angels/Dodgers)
The Book
TheCubdom
The Cutting Edge
The House That Dewey Built
The View From The Bleachers
Tiger Blog
U.S.S. Mariner
Viva El Birdos
Where's Kernan
Minor Leagues
Arizona Fall League
BA Player Finder
Cal Leaguers
Jamey Newberg
JDM's Scoresheet Baseball
Minor League Baseball
Minor League Park Factors
Minor League Splits
No Pepper
Sickels' Minor League Ball
Warm October Nights
BA Player Finder
Cal Leaguers
Jamey Newberg
JDM's Scoresheet Baseball
Minor League Baseball
Minor League Park Factors
Minor League Splits
No Pepper
Sickels' Minor League Ball
Warm October Nights
Amateur
Boyd's World (College)
Cape Cod Baseball League
College Baseball Blog
College Baseball Insider
Collegiate Baseball Newspaper
College Splits
College Splits Blog
Dirtbags Baseball (Long Beach State)
NCAA Baseball
NCBWA
Team One Baseball (High School)
Texas A&M & Baseball
Cape Cod Baseball League
College Baseball Blog
College Baseball Insider
Collegiate Baseball Newspaper
College Splits
College Splits Blog
Dirtbags Baseball (Long Beach State)
NCAA Baseball
NCBWA
Team One Baseball (High School)
Texas A&M & Baseball
Historical
Cuban Baseball
House of David
Jim "Mudcat" Grant's Web Page
Negro League Baseball Players Assoc
Negro Leagues Baseball Museum
1919 Black Sox
Pacific Coast League
Philadelphia Athletics Historical Society
Shoeless Joe Jackson Society
SABR-L Archives
Walter O'Malley
House of David
Jim "Mudcat" Grant's Web Page
Negro League Baseball Players Assoc
Negro Leagues Baseball Museum
1919 Black Sox
Pacific Coast League
Philadelphia Athletics Historical Society
Shoeless Joe Jackson Society
SABR-L Archives
Walter O'Malley
Miscellaneous
Forums
Credits
Ticket Center
Tickets to Baseball -
Premium Red Sox Tickets - Tickets to Marlins Games - Cardinals Game Tickets - NY Yankee Tickets - Tickets Oakland Athletics - Dallas Cowboys Tickets - Arizona Cardinals Tickets - Tickets Seattle Seahawks - Buffalo Bills Tickets Online - Tickets to Dolphins Football
Buy Boston Red Sox tickets,
Philadelphia Phillies tix,
NY Yankees tickets,
NY Mets tickets, and
MLB All Star game tickets at ABC tickets
Not sure where to find the best online sportsbooks? Start your search with PlayersJet.
Get deals at SportsMemorabilia.com on baseball apparel, including Phillies jerseys and more for adults and children.
Shop the largest selection baseball equipment on sale at Sports Unlimited. Check out tons of baseball gloves, youth baseball gloves and catchers gear from Rawlings, Wilson, Nike & Under Armour.
2011 Draft Order
Courtesy of Baseball America
First-Round:
 1. Pirates (57-105)
 2. Mariners (61-101)
 3. Diamondbacks (65-97)
 4. Orioles (66-96)
 5. Royals (67-95)
 6. Nationals (69-93)
 7. Diamondbacks (for B. Loux)
 8. Indians (69-93)
 9. Cubs (75-87)
10. Padres (for Karsten Whitson)
11. Astros (76-86)
12. Brewers (77-85)
13. Mets (79-83)
14. Marlins (80-82)
15. Brewers (for Dylan Covey)
16. Dodgers (80-82)
17. Angels (80-82)
18. Athletics (81-81)
19. Red Sox (from DET for Martinez)
20. Rockies (83-79)
21. Blue Jays (85-77)
22. Cardinals (86-76)
23. Nationals (from CWS for Dunn)
24. Rays (from BOS for Crawford)
25. Padres (90-72)
26. Red Sox (from TEX for Beltre)
27. Reds (91-71)
28. Braves (91-71)
29. Giants (92-70)
30. Twins (94-68)
31. Rays (from NYY for Soriano)
32. Rays (96-66)
33. Rangers (from PHI for Lee)
Supplemental First Round:
34. Nationals (Dunn)
35. Blue Jays (Downs)
36. Red Sox (Martinez)
37. Rangers (Lee)
38. Rays (Crawford)
39. Phillies (Werth)
40. Red Sox (Beltre)
41. Rays (Soriano)
42. Rays (Balfour)
43. Diamondbacks (LaRoche)
44. Mets (Feliciano)
45. Rockies (Dotel)
46. Blue Jays (Buck)
47. White Sox (Putz)
48. Padres (Garland)
49. Giants (Uribe)
50. Twins (Hudson)
51. Yankees (Vazquez)
52. Rays (Benoit)
53. Blue Jays (Olivo)
54. Padres (Torrealba)
55. Twins (Crain)
56. Rays (Choate)
57. Blue Jays (Gregg)
58. Padres (Correia)
59. Rays (Hawpe)
| Touching Bases | February 25, 2010 |
Shot Location Efficiency
A couple weeks ago, I wrote an article using data from basketballgeek showing shot location visualizations. The logical next step from visualizing the data is to use it for more analytical purposes. So I set about to build a model to predict points based on shot location.
Here is the expected field goal percentage based on shot location. The data set runs from 2006-2007 to this year's All-Star Break and contains over 600,000 shots.
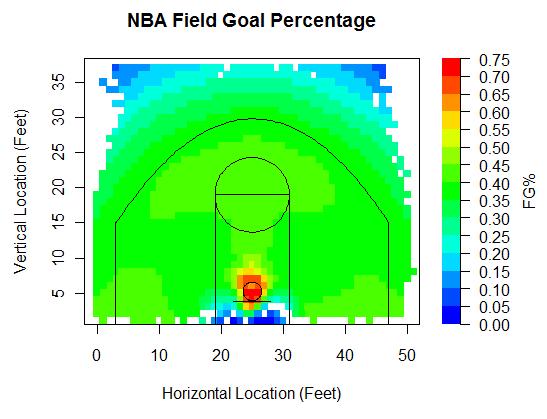
That is the starting point for my model. I take the expected field goal percentage for a given spot on the floor, and multiply it by either two or three, depending on whether the shot is an attempted two pointer or three pointer.
Another part of my model is offensive rebounding rate. From the field goal percentage chart, you can see that some three point locations are as high percentage shots as some two point locations, yet the value of a three pointer is inherently higher. Offensive rebounding rate on three pointers as compared to long two pointers is another reason that mid-range jumpshots are inefficient plays.
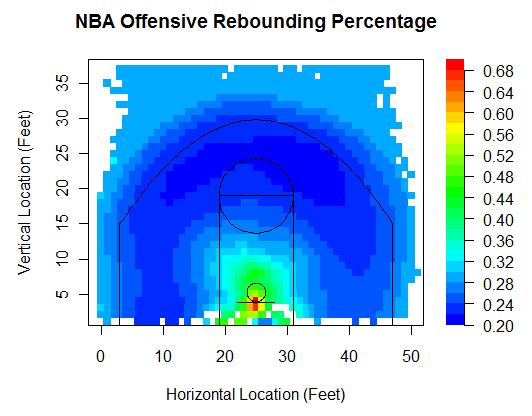
The value of an offensive rebound is contested in the basketball analytics community, as I recently learned. I understand why player evaluations based on linear weights don't work at all in basketball, but I'm not sure why they wouldn't work on the team level. Why can't we say that the average value of an offensive rebound is roughly equal to the average value of adding another possession. If somebody can enlighten me on if and why this assumption is faulty, I would appreciate it. Regardless, the average possession yields something like 1.05 points, so for each shot location, I multiplied the expected missed field goal percentage by the expected offensive rebounding percentage and again multiplied that by 1.05.
Then, I found the shooting foul rate based on shot location. This was a challenge, since the play by play files don't chart foul locations. I therefore used three resources to try to predict shooting foul locations. Ryan Parker collected data that tracks the locations of nearly every event over ten games, including 200 or so shooting fouls, which definitely helped. 82Games has charted shooting fouls, though the data isn't very granular, and they don't mention the magnitude of the study. Lastly, I found the shot locations of all made baskets where there was an and1. Here's what I came up with.
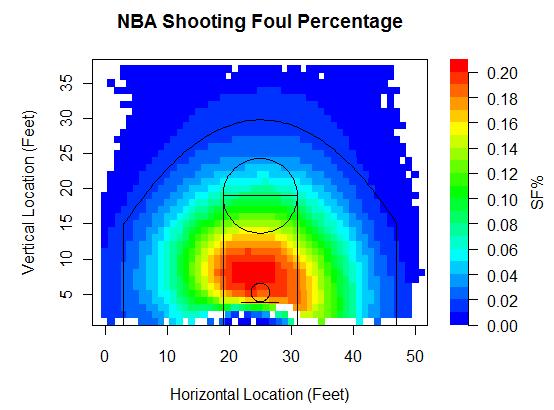
I think the above graph reasonable. It's too smooth, since I think there is probably a steep breaking point where players stop taking mainly jump shots and start playing with their backs to the basket. Jump shots are much less likely to draw fouls than post-ups, however my model can't capture that since I use smoothing techniques. The play-by-play data does include shot type information, so if I had a do-over, I would do some testing based on jumpers vs. other shot types. Anyway, what I do with my shooting foul model is multiply the rate of missed shots at a given location by the shooting foul percentage at that location, and then multiply that by either 2 or 3, and again by either 0.76 or 0.81, depending on whether the respective shot was a 2 or a 3, which represent the number of free throws a player earns for a shooting foul on a missed shot and the made free throw rates on those shots. I also multiplied the rate of made shots by the expected And1 percentage, which is much lower than the shooting foul percentage.
Put that all together, and here's my ultimate point expectancy model.
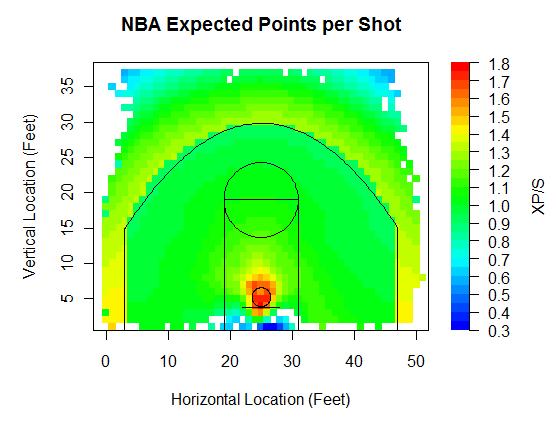
The average is up around 1.25. That's about 0.2 points better than the average possession, since plays that don't result in shots either end up as personal fouls or turnovers, mainly turnovers, which net 0 points. I applied the model on five-man units as well as individual players.
First, the top and bottom five five-man units in shot location efficiency, or expected points per shot. Ideally, some of the shooting, free throw, and rebounding percentage would be customized but I'm using league average rates for this entire study. Minimum 500 shots.
| Unit | Shots | Efficiency | eFG% |
|---|---|---|---|
| Dwight Howard Hedo Turkoglu Jameer Nelson Maurice Evans Rashard Lewis | 768 | 1.34 | 60.81% |
| Boris Diaw Gerald Wallace Nazr Mohammed Raymond Felton Stephen Jackson | 629 | 1.31 | 51.67% |
| Amare Stoudemire Leandro Barbosa Raja Bell Shawn Marion Steve Nash | 598 | 1.31 | 55.52% |
| Dwight Howard Hedo Turkoglu Jameer Nelson Keith Bogans Rashard Lewis | 1480 | 1.30 | 55.07% |
| Boris Diaw Emeka Okafor Gerald Wallace Raja Bell Raymond Felton | 1147 | 1.30 | 53.10% |
| Antonio McDyess Chauncey Billups Rasheed Wallace Richard Hamilton Tayshaun Prince | 1974 | 1.20 | 50.48% |
| Derrick Rose Joakim Noah John Salmons Luol Deng Taj Gibson | 546 | 1.20 | 45.79% |
| Kevin Garnett Mark Blount Mike James Ricky Davis Trenton Hassell | 1243 | 1.20 | 51.05% |
| Brandon Roy Joel Przybilla LaMarcus Aldridge Martell Webster Steve Blake | 1036 | 1.19 | 50.43% |
| Earl Watson Jeff Green Johan Petro Kevin Durant Nick Collison | 517 | 1.19 | 45.16% |
I'm happy to see that the Eastern Conference Champion Magic are the top team on this list because I'd always assumed that their offense last year was extremely efficient. The Magic had two options on offense. Dwight Howard took shots at the rim, while Hedo Turkoglu and Rashard Lewis hoisted threes. That unit was also by far the best in effective field goal percentage in the league, so they were getting high percentage shots, making high percentage shots, and though I can't include their free throw rates or offensive rebounding rates since those would be pains to calculate, I'm sure that with Dwight Howard, the Magic were successful at getting to the line and grabbing rebounds. The Suns, of course, are one of the top five teams.The Bobcats, surprisingly, take highly efficient shots, but don't make many of them. On the other end, we already knew the Bulls run an inefficient offense, and I'm not surprised to see the Pistons do too. That Thunder offense last year must have been absolutely brutal.
Now turning to defense, teams that force the least efficient shots.
| Unit | Shots | Efficiency | eFG% |
|---|---|---|---|
| Dikembe Mutombo Juwan Howard Rafer Alston Shane Battier Tracy McGrady | 766 | 1.20 | 46.54% |
| Dwight Howard Hedo Turkoglu Jameer Nelson Maurice Evans Rashard Lewis | 845 | 1.21 | 48.58% |
| Aaron Brooks Luis Scola Ron Artest Shane Battier Yao Ming | 670 | 1.21 | 46.19% |
| Bruce Bowen Fabricio Oberto Michael Finley Tim Duncan Tony Parker | 858 | 1.21 | 48.95% |
| Chuck Hayes Rafer Alston Shane Battier Tracy McGrady Yao Ming | 1007 | 1.21 | 43.15% |
| Emeka Okafor Gerald Wallace Jason Richardson Jeff McInnis Raymond Felton | 766 | 1.29 | 52.87% |
| Marc Gasol Mike Conley O.J. Mayo Rudy Gay Zach Randolph | 1700 | 1.29 | 52.56% |
| Jeff Green Kevin Durant Nenad Krstic Russell Westbrook Thabo Sefolosha | 1691 | 1.29 | 49.91% |
| C.J. Miles Deron Williams Mehmet Okur Paul Millsap Ronnie Brewer | 768 | 1.29 | 54.75% |
| Boris Diaw Gerald Wallace Nazr Mohammed Raymond Felton Stephen Jackson | 631 | 1.29 | 55.23% |
It's no surprise that the Rockets force teams into low percentage shots, as they boast three of the top five five-man units. That defensive lineup containing Chuck Hayes, Shane Battier, and Yao must be impregnable. And what do you know, but the Magic offense that generated the most efficient shots also had the defense that allowed the second most inefficient shots. Interestingly, the Bobcats offense that ranked second in shot efficiency actually allowed the most expected points per shot on the other end of the floor. I don't think I've watched a Bobcat game this year, but I'd be interested to know what's going on with that unit. A couple surprises on the bottom five list. The Thunder have made noise throughout the league for their much-improved defense, yet it's not a matter of holding opponents to inefficient shots. Instead, their opponents have gotten quality shots off, but have not made them, which would point to an impressive ability to contest shots. Also, the Thunder might do a good job of defensive rebounding and not fouling, which wouldn't appear in the numbers I'm showing.
The next table includes defensive stats for individual players, but still uses data based on the entire five-man opposition. I raised the minimum to 1,000 shots.
| Name | Shots | Efficiency | eFG% |
|---|---|---|---|
| Dikembe Mutombo | 2826 | 1.21 | 43.77% |
| David Harrison | 1360 | 1.21 | 47.65% |
| Shaquille O'Neal | 8909 | 1.22 | 49.34% |
| Yao Ming | 8181 | 1.22 | 45.74% |
| Jacque Vaughn | 2878 | 1.22 | 45.95% |
| Sam Young | 1334 | 1.28 | 50.64% |
| Salim Stoudamire | 1815 | 1.28 | 48.51% |
| Russell Westbrook | 6876 | 1.29 | 49.45% |
| Chris Douglas-Roberts | 2590 | 1.29 | 51.51% |
| Louis Williams | 3580 | 1.29 | 49.50% |
I could've guessed that the top defenders at forcing low percentage shots would be centers, since preventing shots at the rim is the best way to force inefficient jump shots. Dikembe Mutombo, even at (insert whatever made-up hilarious age here), remained an astonishingly good defender. He forced opposing teams into inefficient shots, and no player held rivals to as low an effective field goal percentage as Deke. I'm not sure if any of the guys who show up on the bottom five have reputations as poor defenders. Basketballvalue exhibits poor defensive ratings for Russell Westbrook and Lous Williams and says that by adjusted +/- Sam Young has been a flat-out awful player in general this year, though the guy who runs basketballvalue is the stats guy for Sam Young's team, the Grizzlies.
This table shows how a player's five-man unit performed while he was on the court.
| Name | Shots | Efficiency | eFG% |
|---|---|---|---|
| Steve Francis | 1405 | 1.31 | 48.01% |
| Eddy Curry | 5605 | 1.30 | 49.02% |
| Stephon Marbury | 5168 | 1.30 | 48.13% |
| Renaldo Balkman | 3842 | 1.30 | 47.07% |
| Donyell Marshall | 2634 | 1.30 | 46.70% |
| Antonio McDyess | 9614 | 1.21 | 48.42% |
| Cuttino Mobley | 8225 | 1.21 | 46.33% |
| Earl Barron | 1592 | 1.21 | 44.91% |
| Will Solomon | 1127 | 1.21 | 49.56% |
| Sam Cassell | 4017 | 1.20 | 46.93% |
The top four players were all Knicks during this time frame, as were three of the next eight on the leaderboard. All this is telling us is that Stevie Franchise, Starbury, and Baby Shaq all excel at hanging and banging, and that Isiah is attracted to that type of player. Sam Cassell, on the other hand, can't get to the rim. So I decided to take out a player's own shots, and include only shots by a player's teammates while he was on the floor.
| Name | Shots | Efficiency | eFG% |
|---|---|---|---|
| Steve Francis | 1161 | 1.32 | 49.61% |
| Jameer Nelson | 7475 | 1.31 | 52.49% |
| Stephon Marbury | 4137 | 1.31 | 48.65% |
| Steve Nash | 11406 | 1.30 | 56.11% |
| D.J. Augustin | 2986 | 1.30 | 48.44% |
| Amir Johnson | 3566 | 1.21 | 47.80% |
| Joel Anthony | 3196 | 1.21 | 47.70% |
| Roko Ukic | 1124 | 1.21 | 50.09% |
| Joel Przybilla | 7054 | 1.20 | 48.28% |
| Erick Dampier | 8368 | 1.20 | 49.46% |
At one end are players who spread the ball around and at the other end are players who inhibit floor spacing. Steve Nash's teammates had easily the highest effective field goal percentage, and oh by the way, Nash's own eFG% beats out that of his his teammates. Erick Dampier and Joel "Prezbo" Pryzbilla clog the paint like a hot fudge sundae clogs one's arteries.
Comments
Is it just me.......or is anyone else wondering how articles like this wind up on a baseball website?
Posted by: RW at February 25, 2010 6:20 AM
This was fascinating (and I don't mind it being on a baseball blog!), but I wish the colors chosen for the visualization didn't all look the same between 0.8 and 1.2.
Posted by: dfan at February 25, 2010 6:47 AM
The main reasons I can think of that an offensive rebound may not be worth the same as an average possession (assuming you define "possession" so that a rebound starts a new one), are that:
A) they start from different places on the floor, and
B) they start with the defense in a different state of readiness.
Offensive rebounds would have an advantage over defensive rebounds in terms of A, but possibly a disadvantage in terms of B. It seems like there must have been a study by now that looks at average points per possession depending on the event that starts the possession (steal, made basket, offensive rebound of FGA, offensive rebound of FTA, defensive rebound of FGA, defensive rebound of FTA, dead ball, etc). If anybody knows of one, please post a link here.
Posted by: DavidH at February 25, 2010 7:22 AM
RW, I was wondering if someone would say something to that effect. I'm impressed.
DavidH, I'm surprised there's so much debate over the value of an offensive rebound as well.
Posted by: Jeremy Greenhouse at February 25, 2010 9:03 AM
Could you do some efficiency differential calculations as well? Efficiency O - Efficiency D?
Posted by: DSMok1 at February 25, 2010 9:15 AM
Jeremey, And the answer is.............?
Posted by: RW at February 25, 2010 12:39 PM
@RW, I can't speak for Jeremy or the website, but sometimes it is kind of neat to mix things up, just for fun. You really need this explained to you?
@Jeremy, I for one am really enjoying these, and hope you throw some more in. I'm wondering if you're being too generous in explaining how this year's Thunder are so improved on defense despite giving up efficient shots to opponents. It's certainly possible that you're right, and they're just good at contesting shots without fouling (Durant definitely has the length for that!), but I'm curious if it could also just be luck, and they are due for a major defensive crash at some point. I really like watching them, but I think they're overperforming so far.
The saddest info in this post is that the Bobcats are taking the right shots but just aren't good enough to make them. Reminds me of my JV years.
Posted by: Jake at February 25, 2010 3:31 PM
DSMok1, good idea. I decided to divide the efficiency rates by each other instead of subtracting, so here are the best in efficiency+, as measured as teammates' shot efficiency on offense divided by opponents' shot efficiency on defense. It's a pretty sweet top 5 and bottom 5.
Top 5: Dirk Nowitzki, Tracy McGrady, Sam Cassell (not including his own shots, remember), Kobe Bryant, KG. Those guys are 2.5% better than average.
Bottom: DeJuan Blair, Leon Powe, Eddy CCurry, DeAndre Jordon, Josh Childress, Javale McGee, Joakim Noah. Those guys are 3% below average.
Jake, thanks for the comment. I think my knowledge of basketball has run its course. Interesting take on the Thunder.
Posted by: Jeremy Greenhouse at February 25, 2010 6:44 PM
I do know some Thunder... they run a basic, simple defense and focus on contesting everything. Westbrook, Sefolosha (in particular), and Durant are very long for their positions.
The breakdown: http://www.basketballprospectus.com/article.php?articleid=915
Posted by: DSMok1 at February 26, 2010 8:50 AM
The paltry number of comments reflect interest in this type of article on this site..... No offense - but it's not baseball.
Posted by: RW at February 26, 2010 11:22 AM